Descripción
FPS of your level has been low and you can't figure out why. Was it a HISM-heavy foliage pass? A landscape material with too many texture samples? Three stationary lights stuck on top of each other battling over the same shadow channel?
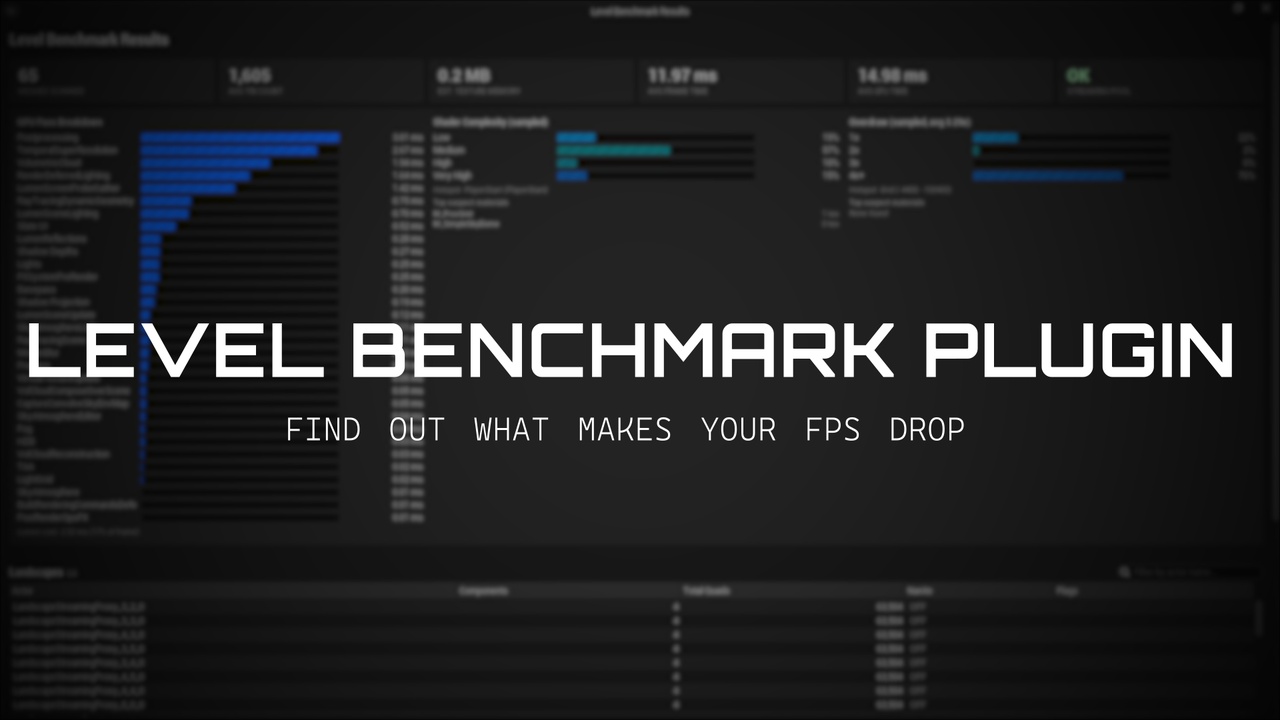
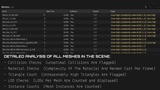
The fix usually means tabbing between half a dozen stat commands, squinting at an on-screen HUD, and trying to remember what normal even looks like. Level Benchmark turns it into one button. Run it on your currently loaded level and get back a single readable report: every mesh's triangle count, LOD count, material count, texture resolution, collision, and Nanite status along with instanced and foliage components counted at their actual effective cost, not just per-instance. Every light's type, mobility, shadow-casting status, and overlaps with other nearby lights that could be killing your shadow channel budget.
Real GPU pass timings, shader complexity, and overdraw, sampled from directly within PIE, then cross-referenced back into one table, so you know precisely which actor to open and not just that something, somewhere is slow.
Built for solo devs and small teams without a dedicated technical artist keeping an eye on frame times all day. Catch that quietly-expensive mesh before a playtester finds it for you and with V2's budgets and CI gating, catch it before it even merges.
Checks
Static Analysis (PIE-Free): Per-mesh triangle count, LOD count, material count, max texture resolution, collision status, Nanite status. For instanced/foliage (ISM/HISM) meshes, triangle count is their effective triangle count, not per instance.
Landscape Scan: Component count, quad count, and Nanite status for each landscape proxy.
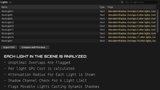
Light Scan: type, mobility, attenuation radius, shadow casting, overlapping light detection, and stationary shadow cluster warnings.
Material Cost Ranking: the materials responsible for most of the shader complexity and overdraw, ranked and linkable back to the meshes using them.
Estimated Texture Memory: actual measured GPU size, deduplicated across the level per unique texture, meshes and landscape materials both.
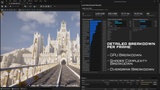
GPU Pass Timing (PIE): actual breakdown of GPU cost per-pass, including Lumen's specific share of your frame.
Shader Complexity & Overdraw (PIE): real scene captures decoded with your project's color ramps, now sampled across a grid spanning the whole level (not just a couple of fixed points), shown in percentage buckets with hotspot reporting.
Per-Light GPU Cost (PIE, optional): isolates individual shadow casting light's GPU cost by toggling them on/off and measuring the difference, with auto camera setup nearby.
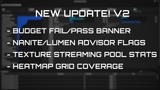
Nanite & Lumen Advisor (New): flags Nanite turned on for meshes too low-poly to be worth the overhead, and materials with World Position Offset on a Nanite mesh (extra lighting cost you didn't ask for).
Texture Streaming Audit (New): live streaming pool size and how far over budget it is, read straight from the engine's own streaming manager.
Configurable Budgets & Pass/Fail (New): set your own thresholds for tri count, GPU time, shader complexity, overdraw, and texture memory — Mobile/Console/PC presets to start from, fully editable. Every run gives you a clear pass or fail.
CI Regression Gating (New): run headless from the command line with a baseline CSV and a regression percentage, get a non-zero exit code back if the level got worse than your threshold. Drop it straight into a CI pipeline.
Run Comparison: compare current run to a previously exported CSV.
CSV Export: 3 files (meshes, lights, summary).
Toolbar, Tools Menu, Window Menu, and command line for automated runs.
Keep in mind
Shader complexity/overdraw is sampled at a set of points across the level (a grid plus player starts, capped for performance), not a full per-pixel heat-map.
On UE 5.8, "stat gpu" will be visible in PIE if "Run GPU pass timing" is enabled (disable manually if you don't want it).
Budget presets (Mobile/Console/PC) are reasonable starting points, not verified real console specs — tune them for your actual target hardware.
Full limitations and flags in the docs (linked below).
Requirements
UE 5.7 or 5.8.
Windows (tested, others un-tested).
Editor-Only: No cost in packaged builds.
Documentation https://github.com/Imloopdev/Level-Benchmark-UE5