
Opis
Performance Profiler is a comprehensive runtime profiling tool for Unreal Engine. Place the PerformanceProfilerActor in your level and use the "profiler" console command to start/stop recording.
KEY FEATURES
• Real-time On-Screen Display - Color-coded FPS, thread timings, memory usage, and render stats displayed during gameplay
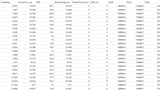
• CSV Data Export - Frame-by-frame performance data exported to CSV for analysis in Excel or other tools
• Blueprint Profiling - Track which Blueprint classes are consuming the most CPU time with tick counts and execution times
• FPS Heatmap - Spatial mapping of performance across your level, identify problem areas by position
• Thread Timing - Monitor Game Thread, Render Thread, GPU, and RHI Thread separately to identify bottlenecks
• Hitch Detection - Automatic detection and logging of frame spikes above configurable threshold
• VR Support - Track dropped frames against VR target framerate (Quest, PCVR)
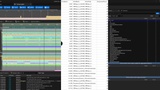
• Unreal Insights Integration - Automatic trace recording for deep analysis
• Screenshot on Drop - Automatic screenshots when FPS drops below threshold
• Garbage Collection Monitoring - Track GC events, frequency, and duration
USAGE
1. Place PerformanceProfilerActor in your level
2. Play the game
3. Open console (~) and type "profiler" to start
4. Play through problem areas
5. Type "profiler" again to stop and save
6. Find results in Saved/Profiling/
OUTPUT FILES
• PerfLog_*.csv - Frame-by-frame data (FPS, threads, memory, draw calls, triangles)
• PerfLog_*_summary.txt - Session statistics summary
• PerfLog_*_heatmap.csv - FPS mapped to 3D world positions
• PerfLog_*_blueprint_stats.csv - Blueprint class performance
• PerfLog_*.json - JSON export for external tools
• *.utrace - Unreal Insights trace file
BLUEPRINT API
All functions exposed to Blueprints:
• ToggleProfiler(), IsProfilerActive()
• GetCurrentFrameData(), GetSessionSummary()
• GetHeatmapData(), GetBlueprintStats()
• AddMarker(), TakePerformanceScreenshot()
• ForceGCAndMeasure(), ExportSessionToJSON()
Perfect for identifying bottlenecks during development, QA testing, and performance optimization.
---
Technical Details
Features:
• Real-time FPS monitoring with on-screen display
• CSV export with 25+ metrics per frame
• Blueprint execution profiling
• FPS heatmap by world position
• Thread timing (Game, Render, GPU, RHI)
• Hitch detection and logging
• VR dropped frame tracking
• Unreal Insights trace integration
• Garbage collection monitoring
• Screenshot capture on FPS drop
Code Modules: PerformanceProfiler (Runtime)
Number of Blueprints: 0
Number of C++ Classes: 2
Network Replicated: No
Supported Development Platforms: Windows, Mac, Linux
Supported Target Build Platforms: Windows, Mac, Linux
Documentation: Included (PDF)
Need help or want to share feedback?
Support: [email protected]
Report a bug: https://www.pixelsdesign.it/bug-report.html
Request a feature: https://www.pixelsdesign.it/feature-request.html