

Descripción
DOCUMENTATION - EXAMPLE VIDEO (WIP) - SUPPORT
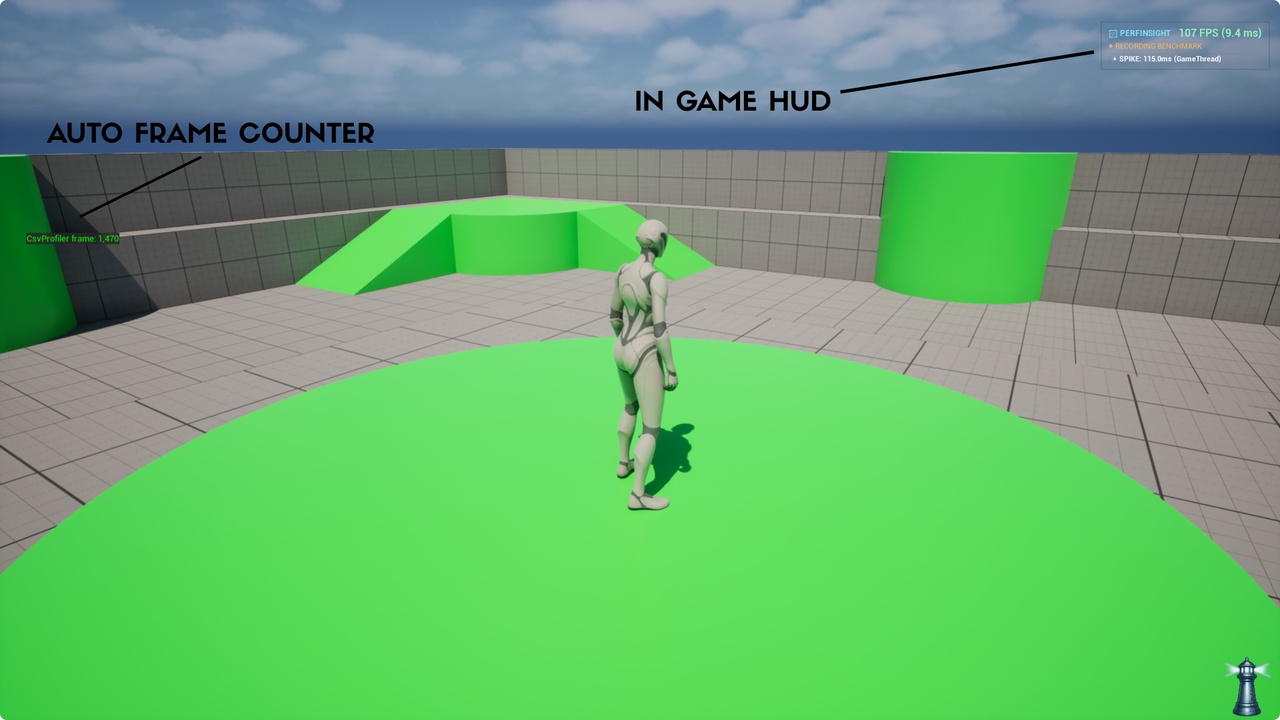
Unreal Engine ships with capable profiling tools, including the CSV profiler and Unreal Insights. Both produce a large amount of raw data that takes engine experience to interpret. PerfInsight sits on top of those systems, reads the timing numbers, and presents a report that any member of the team can act on.
You capture a play session from a dockable editor panel or from Blueprint. Within a second or two of stopping, PerfInsight shows the frame time graph, the smoothness metrics, the detected spikes, the heaviest Blueprint classes in your level, and the largest assets in memory. A single button exports the whole thing as a self contained HTML dashboard.
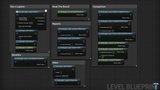
No C++ is required. Every feature is available from Blueprint nodes and from the editor panel.
Metrics that reflect the player experience
A good average frame rate does not guarantee a smooth game. PerfInsight reports the numbers that describe consistency:
1 percent low and 0.1 percent low frame rate, which represent the average frame rate during your worst frames.
95th and 99th percentile frame time, along with the standard deviation of frame time.
Hitch counts grouped into minor, major, and severe tiers by absolute duration, plus a hitches per minute figure.
The percentage of frames that missed the target budget, and a relative spike count measured against a dynamic rolling baseline.
Attribution
For every spike, PerfInsight identifies the dominant thread (Game, Render, GPU, or RHI). The HTML report also includes a Frame Budget Breakdown built from every numeric column your CSV profile contains, so physics, animation, and audio time appear when your project records them. Scene complexity figures such as draw calls, primitive counts, and triangle counts are reported as average, 99th percentile, and peak values.
After a capture completes, PerfInsight scans the active world to rank Actor and Blueprint classes by ticking instances and component count, and scans loaded assets to list the largest textures, meshes, and audio files by size in memory.
Memory analysis
Physical memory is sampled at a configurable interval during the capture. At the end of the run, PerfInsight fits a linear trend to the samples and raises a warning when the growth rate exceeds a configurable threshold with a good statistical fit. This approach catches gradual leaks that a strict "always increasing" check would miss.