

Description
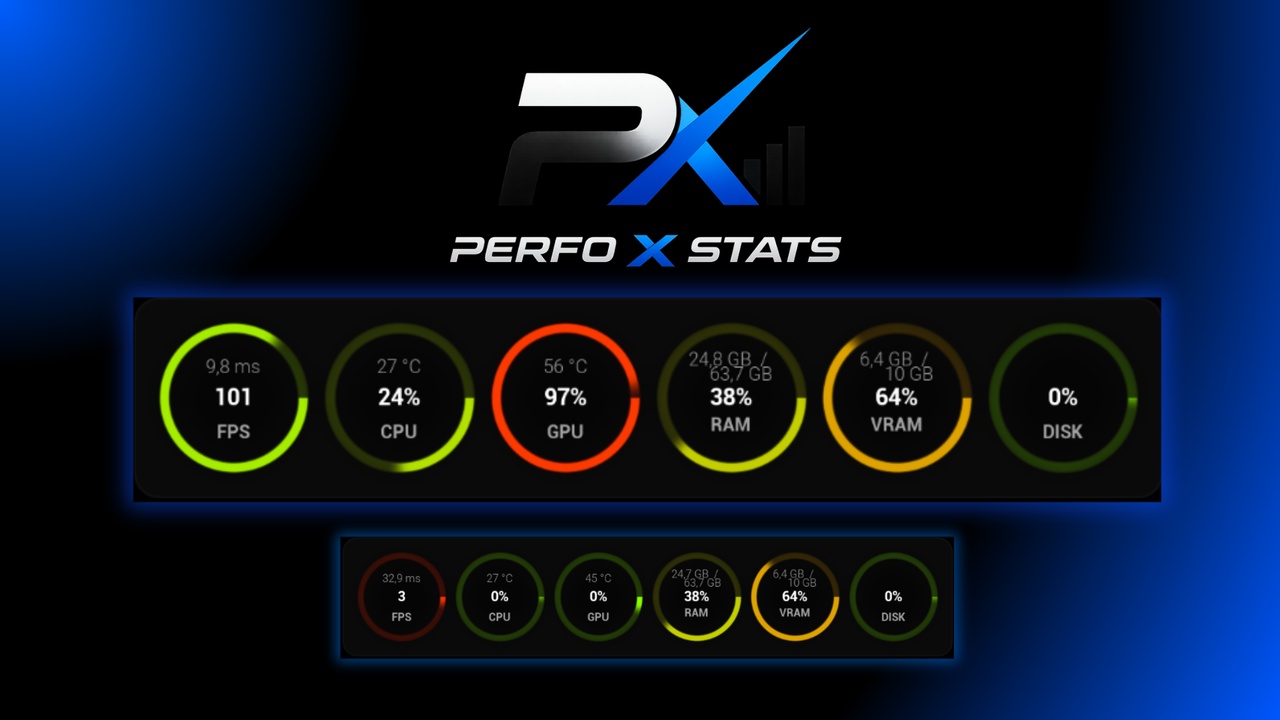
PerfoX is a lightweight system performance monitoring plugin for Unreal Engine — it works both in the editor and in packaged games.
🎥 Video Presentation: >>> HERE <<<
🛠️ Support (Discord): >>> HERE <<<
📄 Documentation: >>> HERE <<<
Open the dockable PerfoX Monitor tab (Tools → Miscellaneous) to watch live, color-coded bars with your machine's current load, or use the Blueprint nodes to display the same data in your own UMG widgets — e.g. as an in-game performance overlay or a diagnostics screen for your players.
What it measures:
- FPS & frame time — engine-averaged values (same as `stat fps`)
- CPU — usage %, processor name, physical cores and logical threads
- RAM — usage % and GB (used / total)
- GPU — usage % with two selectable methods: Windows Task Manager style, or straight from the driver (NVIDIA NVML / AMD ADL)
- VRAM — video memory: used / total / %
- Disks — average activity across all physical disks, plus per-drive activity and space usage
- Temperatures — GPU and CPU with an automatic source cascade: LibreHardwareMonitor/OpenHardwareMonitor (true core temperature), ACPI, OS thermal zone
Built for performance:
- static data (hardware names, core counts, total RAM/VRAM, drive capacities) is collected once and cached — call `Get Hardware Info` once on Begin Play,
- dynamic data comes from `Get Performance Stats` — sampling is hard-capped at 4×/s; more frequent calls return the cache with zero work,
- a single performance-counter query per sample, no allocations on the cached path.
Zero dependencies: only native Windows APIs (PDH, WMI, DXGI) and dynamically loaded driver libraries (NVML/ADL)
Blueprint nodes: `Get Hardware Info`, `Get Performance Stats`, `Get System Stats`, `Set Gpu Usage Method`, `Get Frame Rate`, `Get Cpu/Gpu Usage Percent`, `Get Cpu/Gpu Temperature`.