


Описание
Scene Optimizer: Automated Performance Analysis & Optimization for UE 5.6 & 5.7
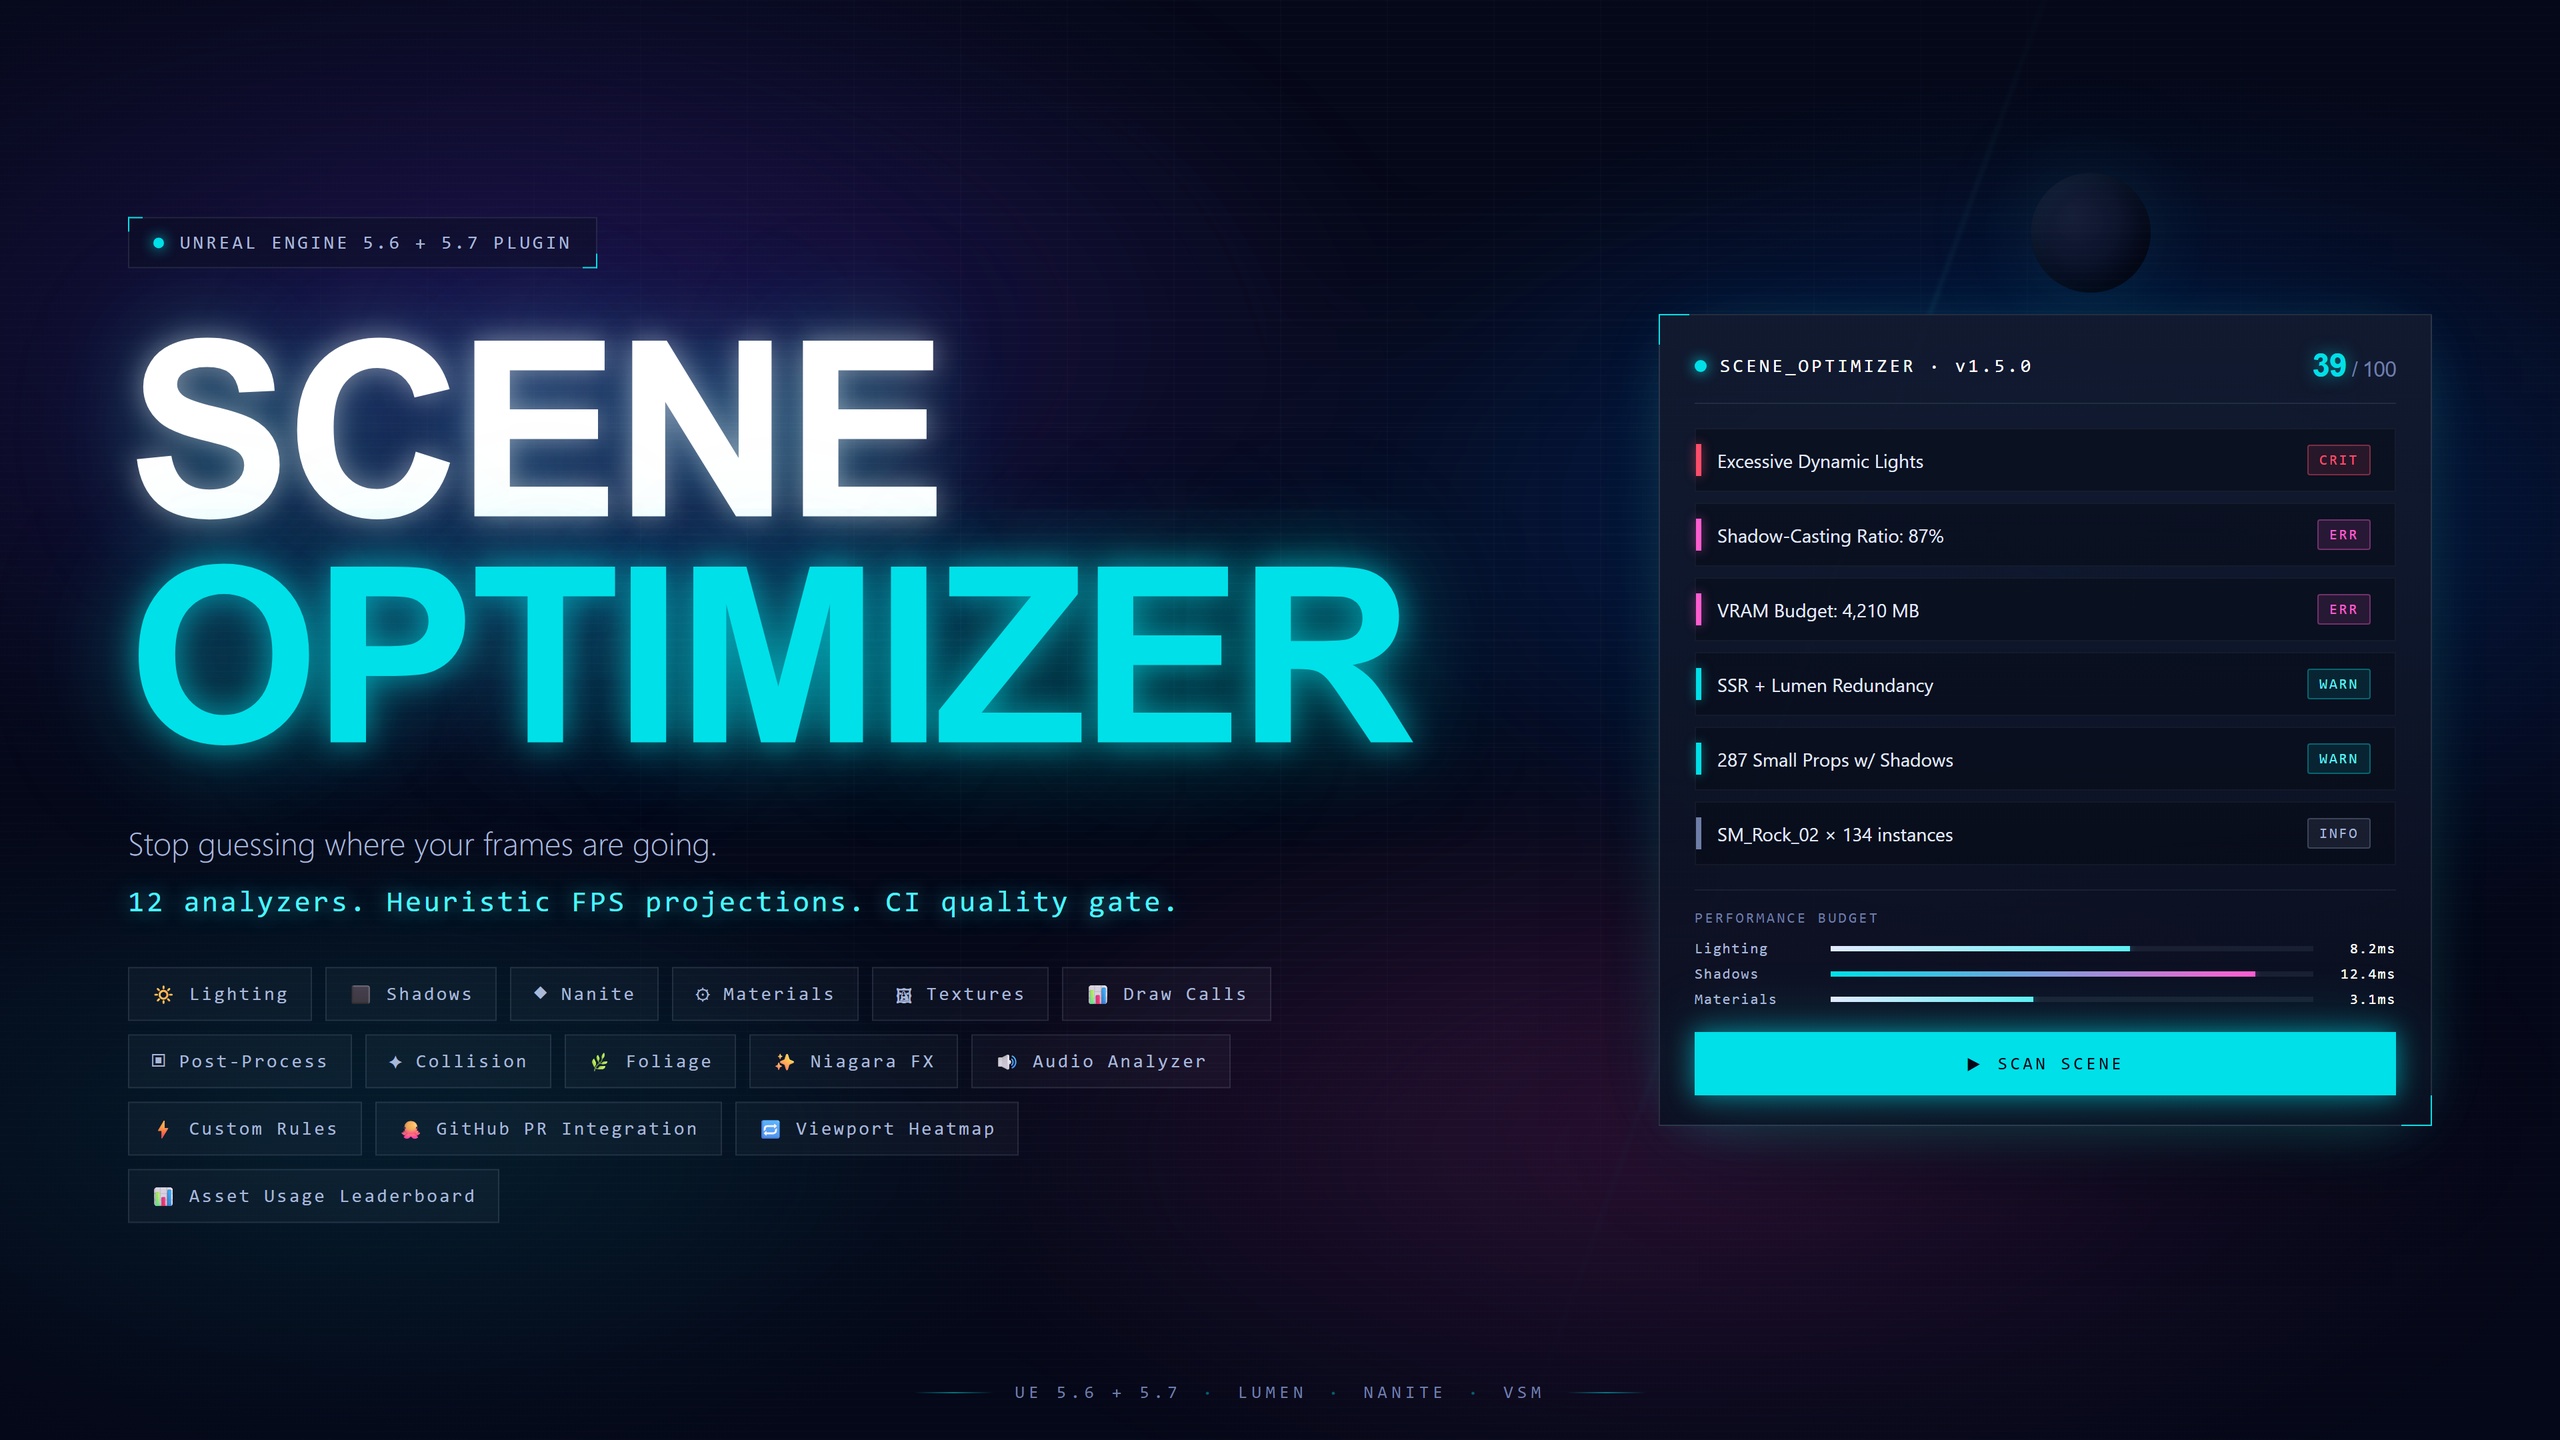
Stop guessing where your frames might be going. Scene Optimizer scans your entire level, identifies likely sources of performance issues, projects the heuristic FPS impact of each one, and fixes many of them with a single click from inside the editor.
📚 Documentation | 💬 Discord | ▶️ Demo Video (1.0.0) | ▶️ 1.4.0 Update Overview | 📋 Changelog
Why Scene Optimizer?
UE5 gives you Lumen, Nanite, Virtual Shadow Maps, and a powerful post-processing pipeline, features that are easy to misuse. A few redundant shadow-casting lights, hundreds of small props with unnecessary shadows, 4K textures on meshes you'll never see up close, or SSR stacked on top of Lumen reflections can silently destroy your frame rate. You won't notice until late in development, when profiling becomes urgent and expensive.
Scene Optimizer catches these problems early. One click gives you a full performance audit with a score out of 100, a ranked list of every issue, and a heuristic FPS-impact projection at three hardware tiers. Fix the issues that matter most, re-scan, and watch your score climb without leaving the editor.
12 Built-In Analyzers
🔦 Lighting Analyzer Dynamic light count, shadow-casting overhead, oversized attenuation radii, light overlap cluster detection, Lumen-specific issues (rect lights, cascades). Lumen-aware, never suggests changes that would degrade Lumen performance.
🌑 Shadow Analyzer The highest-impact analyzer for FPS improvement. Identifies shadow-casting mesh ratio, small props casting unnecessary shadows (the single biggest VSM optimization in most scenes), and excessive shadow draw distances.
🔷 Nanite Analyzer Nanite-fallback-aware analysis (avoids false positives from reading fallback mesh tri counts). Detects high-poly meshes missing Nanite, excessive instance counts, missing fallback LODs, and Nanite with translucent materials.
🎨 Material Analyzer Shader complexity estimation, excessive texture samples, unique material count (draw call pressure), translucency overuse, single-use materials, and null material slots.
🖼️ Texture Analyzer VRAM budget tracking with per-texture breakdown showing resolution, format, VRAM size, and percentage of total budget. Top 5 offenders listed directly in the summary. Oversized textures on small meshes, uncompressed texture detection, non-power-of-two warnings. Click "Open Texture" to jump straight to the Texture Editor. Respects Maximum Texture Size settings, re-scan after resizing and the issue disappears.
📐 Draw Call / Instancing Analyzer Finds static meshes placed 10+ times as individual actors, each copy is a separate draw call. Reports instancing candidates with exact copy counts. Flags high actor counts and overly complex actors (50+ components).
🎬 Post-Processing Analyzer Flags expensive Lumen quality settings, Hardware Ray Tracing, redundant SSR stacked with Lumen Reflections, high bloom, shallow DOF, motion blur, and multiple unbounded Post Process Volumes.
💥 Collision Analyzer Detects Complex-as-Simple collision on high-poly meshes (extremely expensive for physics traces) and large meshes missing collision that may be walkable surfaces.
🌿 Foliage Analyzer Identifies shadow-casting foliage instances (major VSM cost in outdoor scenes), excessive foliage density (50K+ instances), and translucent foliage materials that can't use Nanite or Lumen GI.
✨ Niagara FX Analyzer: Niagara is one of the top three frame killers in modern UE5 scenes. Catches ten FX performance issues: GPU emitters without fixed bounds (forces per-frame CPU readback for culling), CPU-sim emitters that should be GPU on mass-spawned systems, uncapped GPU spawn rates, translucent renderer overdraw, per-particle light components (always catastrophic when present), high-poly mesh renderers (per-particle draw cost multiplier), persistent-IDs misuse, and missing Niagara Effect Type assignments. Includes a "Capture Fixed Bounds" quick-action that snapshots the component's live world bounds (with 25% safety margin) and writes them back to the system in one click.
🔊 Audio Analyzer: Twelve audio-performance issue types covering wave, cue, attenuation, concurrency, procedural-source, and scene-wide checks: under-compressed waves, large loaded waves (>1 MB non-streaming), high sample rates (>48 kHz), infinite attenuation falloff, deep SoundCue nesting (cycle-safe graph walker — won't hang on hand-authored cues with accidental cycles), concurrency over-budget, procedural-wave abuse, and per-scene AudioComponent rollups. MetaSounds-aware via USoundBase polymorphism. Quick-actions for setting compression quality (via FProperty reflection, since CompressionQuality is private) and flipping streaming on large waves.
🐙 GitHub PR Integration
Performance Estimator: Heuristic, Tier-Aware
The Performance Estimator sums calibrated ms-cost estimates per detected issue and converts the total overhead to FPS at three preset hardware tiers.
A budget breakdown across five categories; lighting, shadows, materials, geometry, draw calls, shows where the overhead is concentrated. Per-issue cost projections feed a "Top Fixes by Impact" ranking so you know what's worth doing first.
These FPS values are heuristic estimates, not measurements and not guarantees of shipped framerate. They are intended for relative comparison between scenes and before/after fixes, actual frame rate in a packaged build depends on factors a static analyzer cannot inspect. See "About FPS Estimates" below.
About FPS Estimates
The FPS values reported by Scene Optimizer are heuristic projections derived from a static analysis of scene assets. They are NOT measurements and NOT guarantees of shipped performance. Actual frame rate in a packaged build depends on factors a static analyzer cannot inspect: engine version, RHI selection, scalability settings, render resolution, dynamic resolution scaling and upscalers, the post-process stack, gameplay logic, AI, physics, animation, audio, driver version, OS version, thermal state, and the player's specific hardware (including CPU bottlenecking and storage I/O that affect the same nominal GPU differently in different machines).
Use the estimates for relative comparison and prioritization, "scene A reports ~45 FPS, scene B reports ~60 FPS at the same tier" is information you can act on. "I expect my players on RTX 3060s to see exactly 47 FPS" is not, that's a measurement question, and a static analyzer cannot answer it. The "After Fix" totals assume every suggested fix (auto and manual) is applied, with manual fixes projected at a flat 30% cost reduction; real-world fix outcomes will vary.
And much more. See the features list document for all features of the plugin.
Technical Details
Engine Version: Unreal Engine 5.6 & 5.7
Platforms: Windows
Modules: Runtime (available in-game) + Editor (UI, toolbar, viewport overlay)
Source: Full C++ source code included
Blueprint: Features exposed to Blueprint
Analyzers: 12 built-in + custom rule engine
Lumen & Nanite: Fully aware, fixes adapt to your rendering pipeline
What's Included
Full C++ source code (Runtime + Editor modules)
12 built-in analyzers covering lighting, shadows, Nanite, materials, textures, draw calls, post-processing, collision, foliage, and custom rules
5 auto-fix handlers with undo support (Lumen-safe)
Performance estimator with FPS predictions and budget breakdowns
Viewport overlay with 3D issue markers and HUD
Category + severity filtering in results panel
"Go To" viewport navigation and "Open Texture" for texture issues
Report exporter (JSON + HTML with trend charts)
CI commandlet with quality gates and build ID tracking
Trend tracking with regression detection
Webhook notifications (Slack, Discord, Custom)
Blueprint function library
Configurable settings with Project Settings integration
Full documentation with webhook setup tutorials, CI/CD examples, and FAQ