Description
Your Blueprints are slower than you think, and the reasons are invisible.
A line trace inside a pure function looks like a free getter. A Get All Actors Of Class three
loops deep looks like one node. A Delay on Event Tick looks like a timer. None of these show up
in the graph as a problem, and none of them appear in a profiler as anything you can name.
GraphMedic finds them, tells you exactly where they are, and explains why each one costs you.
### What it finds
Expensive work on a per-frame path. Known-costly nodes reachable from Event Tick, Component
Tick, or an Animation Blueprint's update event — the last of which runs every frame on every
instance of that mesh and is somewhere almost nobody thinks to look.
Latent nodes on Tick. A `Delay` hanging off Event Tick, with no `DoOnce` or `Gate` in
between. GraphMedic distinguishes guarded from unguarded and names the guard, so you get a
Critical for the real cases and a Warning for the deliberate ones — instead of forty identical
false alarms.
Costly work inside loops. Once-per-iteration expense anywhere in the graph, with the
innermost enclosing loop named and the nesting depth reported. Nested loops are flagged
separately, and three levels deep is escalated on its own.
Pure functions doing real work. The finding most developers cannot spot unaided. A pure node
has no exec pin, so the compiler re-evaluates it **once per connected output pin, at every read,
with no caching**. A trace inside a pure `IsPointVisible` runs every single time the result is
read. GraphMedic flags pure functions containing traces, spawns, loads or loops.
Timeline update costs. A Timeline's Update pin is a per-frame path with no Tick node anywhere
near it — which is exactly why expensive work ends up there and stays.
Dead nodes. Nodes with execution pins that are wired to nothing and can never run.
### A report you can actually work through
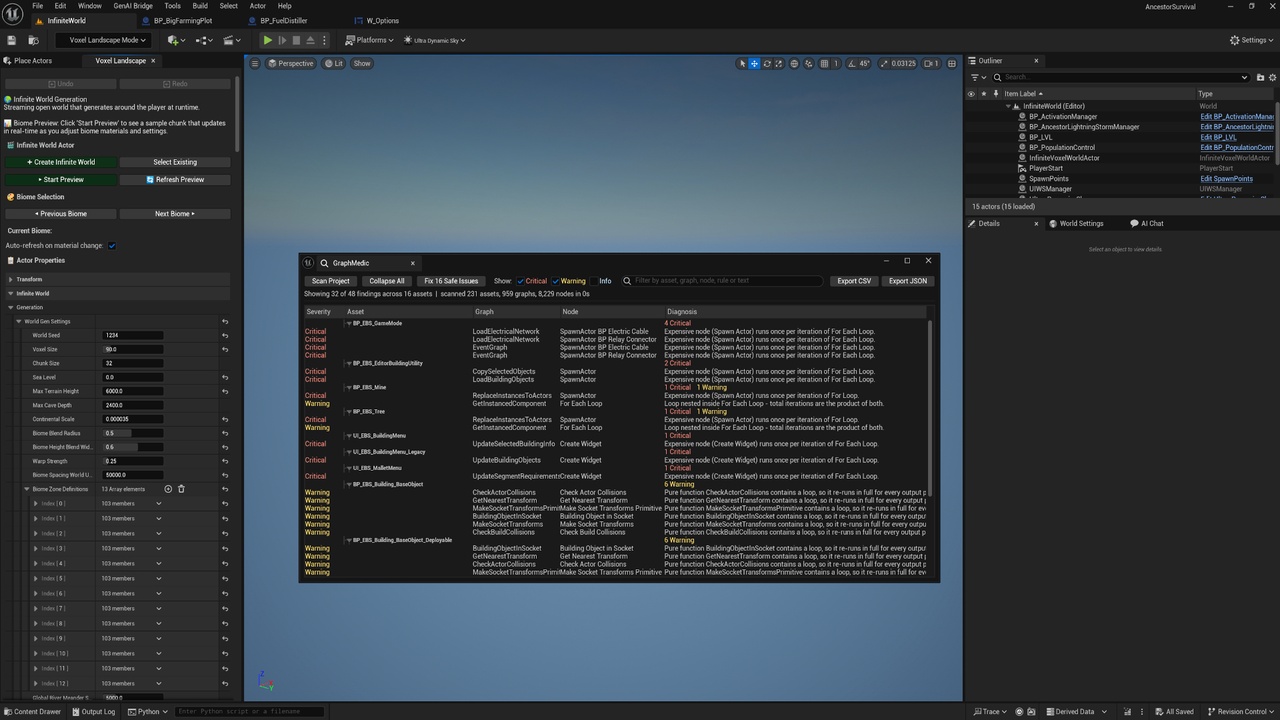
Findings group by asset, worst asset first, each header showing its own tally. A project with
1,500 findings becomes a list of the assets that need attention — and it turns out to be a much
shorter list, because the same habit tends to repeat.
- Double-click any finding to open that Blueprint with the graph centred on the offending node
- Search across asset, graph, node, rule id or diagnosis text
- Filter by severity
- Export CSV or JSON to triage outside the editor, or to diff against a later scan and prove
a cleanup pass actually reduced something
### Auto-fix that earns your trust
One click deletes unreachable nodes and empty Tick events. Three things make that safe to run
across hundreds of assets:
- Every fix is re-verified against the live graph first. If you wired that "unreachable" node
up after scanning, the finding no longer holds — and GraphMedic refuses to touch it.
- The whole batch is a single undo.
- Nothing is saved. Assets are left modified for you to review, with optional `.uasset`
backups taken beforehand.
Afterwards you get a full list of every node deleted, skipped or failed, and a CSV audit log —
because "fixed 400 nodes" with no record of which ones is not something anyone should trust twice.
### Tune it to your project
Every threshold and the entire costly-node list live in Project Settings, not in code. Add your
own project's known-expensive nodes, raise or lower the Tick chain thresholds, suppress a rule
project-wide, and narrow the scan to your own content folder.
### Built and proven on a real project
GraphMedic was developed against a shipping-scale VR survival game and validated on a
3,397-asset project — 14,783 graphs and 313,807 nodes. Every rule in it exists because it
found something real.