Opis
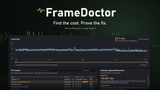
Find expensive CPU work. Verify your next optimization.
A frame-time spike tells you something is wrong. It does not tell you where to focus, what to change, or whether your fix actually helped.
FrameDoctor brings CPU profiling, repeatable captures and before-and-after performance comparison into Unreal Engine. Turn recorded traces into measured findings, test your changes across repeated runs, and share the evidence with your team.
Documentation: Read the FrameDoctor documentation for installation, capture setup, performance comparison and troubleshooting.
Spend your optimization time where it matters
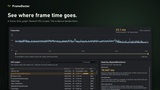
Find CPU work worth investigating. Inspect named scopes by thread, their inclusive and exclusive timing where available, call counts and affected frames. Keep measured evidence, interpretation and the next experiment in view.
Look beyond average FPS. Review mean, p95 and p99 game-frame time to understand slow frames that an average can hide.
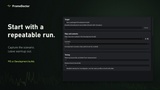
Make captures repeatable. Use scenario readiness checks, a separate warmup period and a defined measurement window. Save profiles to reuse your capture settings.
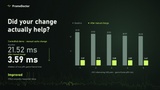
Check whether a change holds up. Compare separate baseline and candidate Development builds across alternating A/B runs. See every pair, the measured variation and the threshold behind the result.
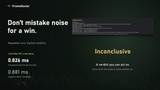
Know when to investigate further. Clear Improved, Regressed, Inconclusive and InvalidComparison results help you distinguish a consistent change from noisy or mismatched measurements.
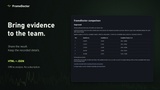
Share a result your team can inspect. Export readable HTML reports, detailed JSON and portable evidence bundles with optional raw traces.
From a slow frame to a tested change
Capture. Record a running PIE session, launch a packaged Development build, or import an existing compatible .utrace file.
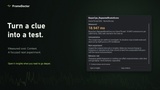
Investigate. Review CPU findings and their evidence, choose a focused experiment, and make your change.
Compare. Repeat the scenario across both builds, inspect the verdict and export the result.
Built for your development workflow
Use FrameDoctor when tuning CPU-heavy gameplay, checking whether a refactor introduced a regression, or handing a reproducible performance finding to another developer.
Analysis and comparison run locally. No external AI service, subscription or service account is required. Keep your traces and reports on your machine until you choose to share them.
Requirements and scope
Windows (Win64). Choose a compatible Unreal Engine build from this listing. Source installation and example builds require the matching Unreal Engine C++ toolchain, including for projects that began as Blueprint-only.
Capture supports PIE and packaged Development workflows. Confirming comparisons require a repeatable scenario with declared conditions and compatible captures. Capture controls are excluded from Shipping builds.
FrameDoctor focuses on CPU traces and game-frame performance. Changes are implemented and behavior-tested by you. It does not automatically optimize code, measure individual Blueprint nodes, or replace a dedicated GPU profiler.
Find the cost. Test the change. Keep the evidence.