描述
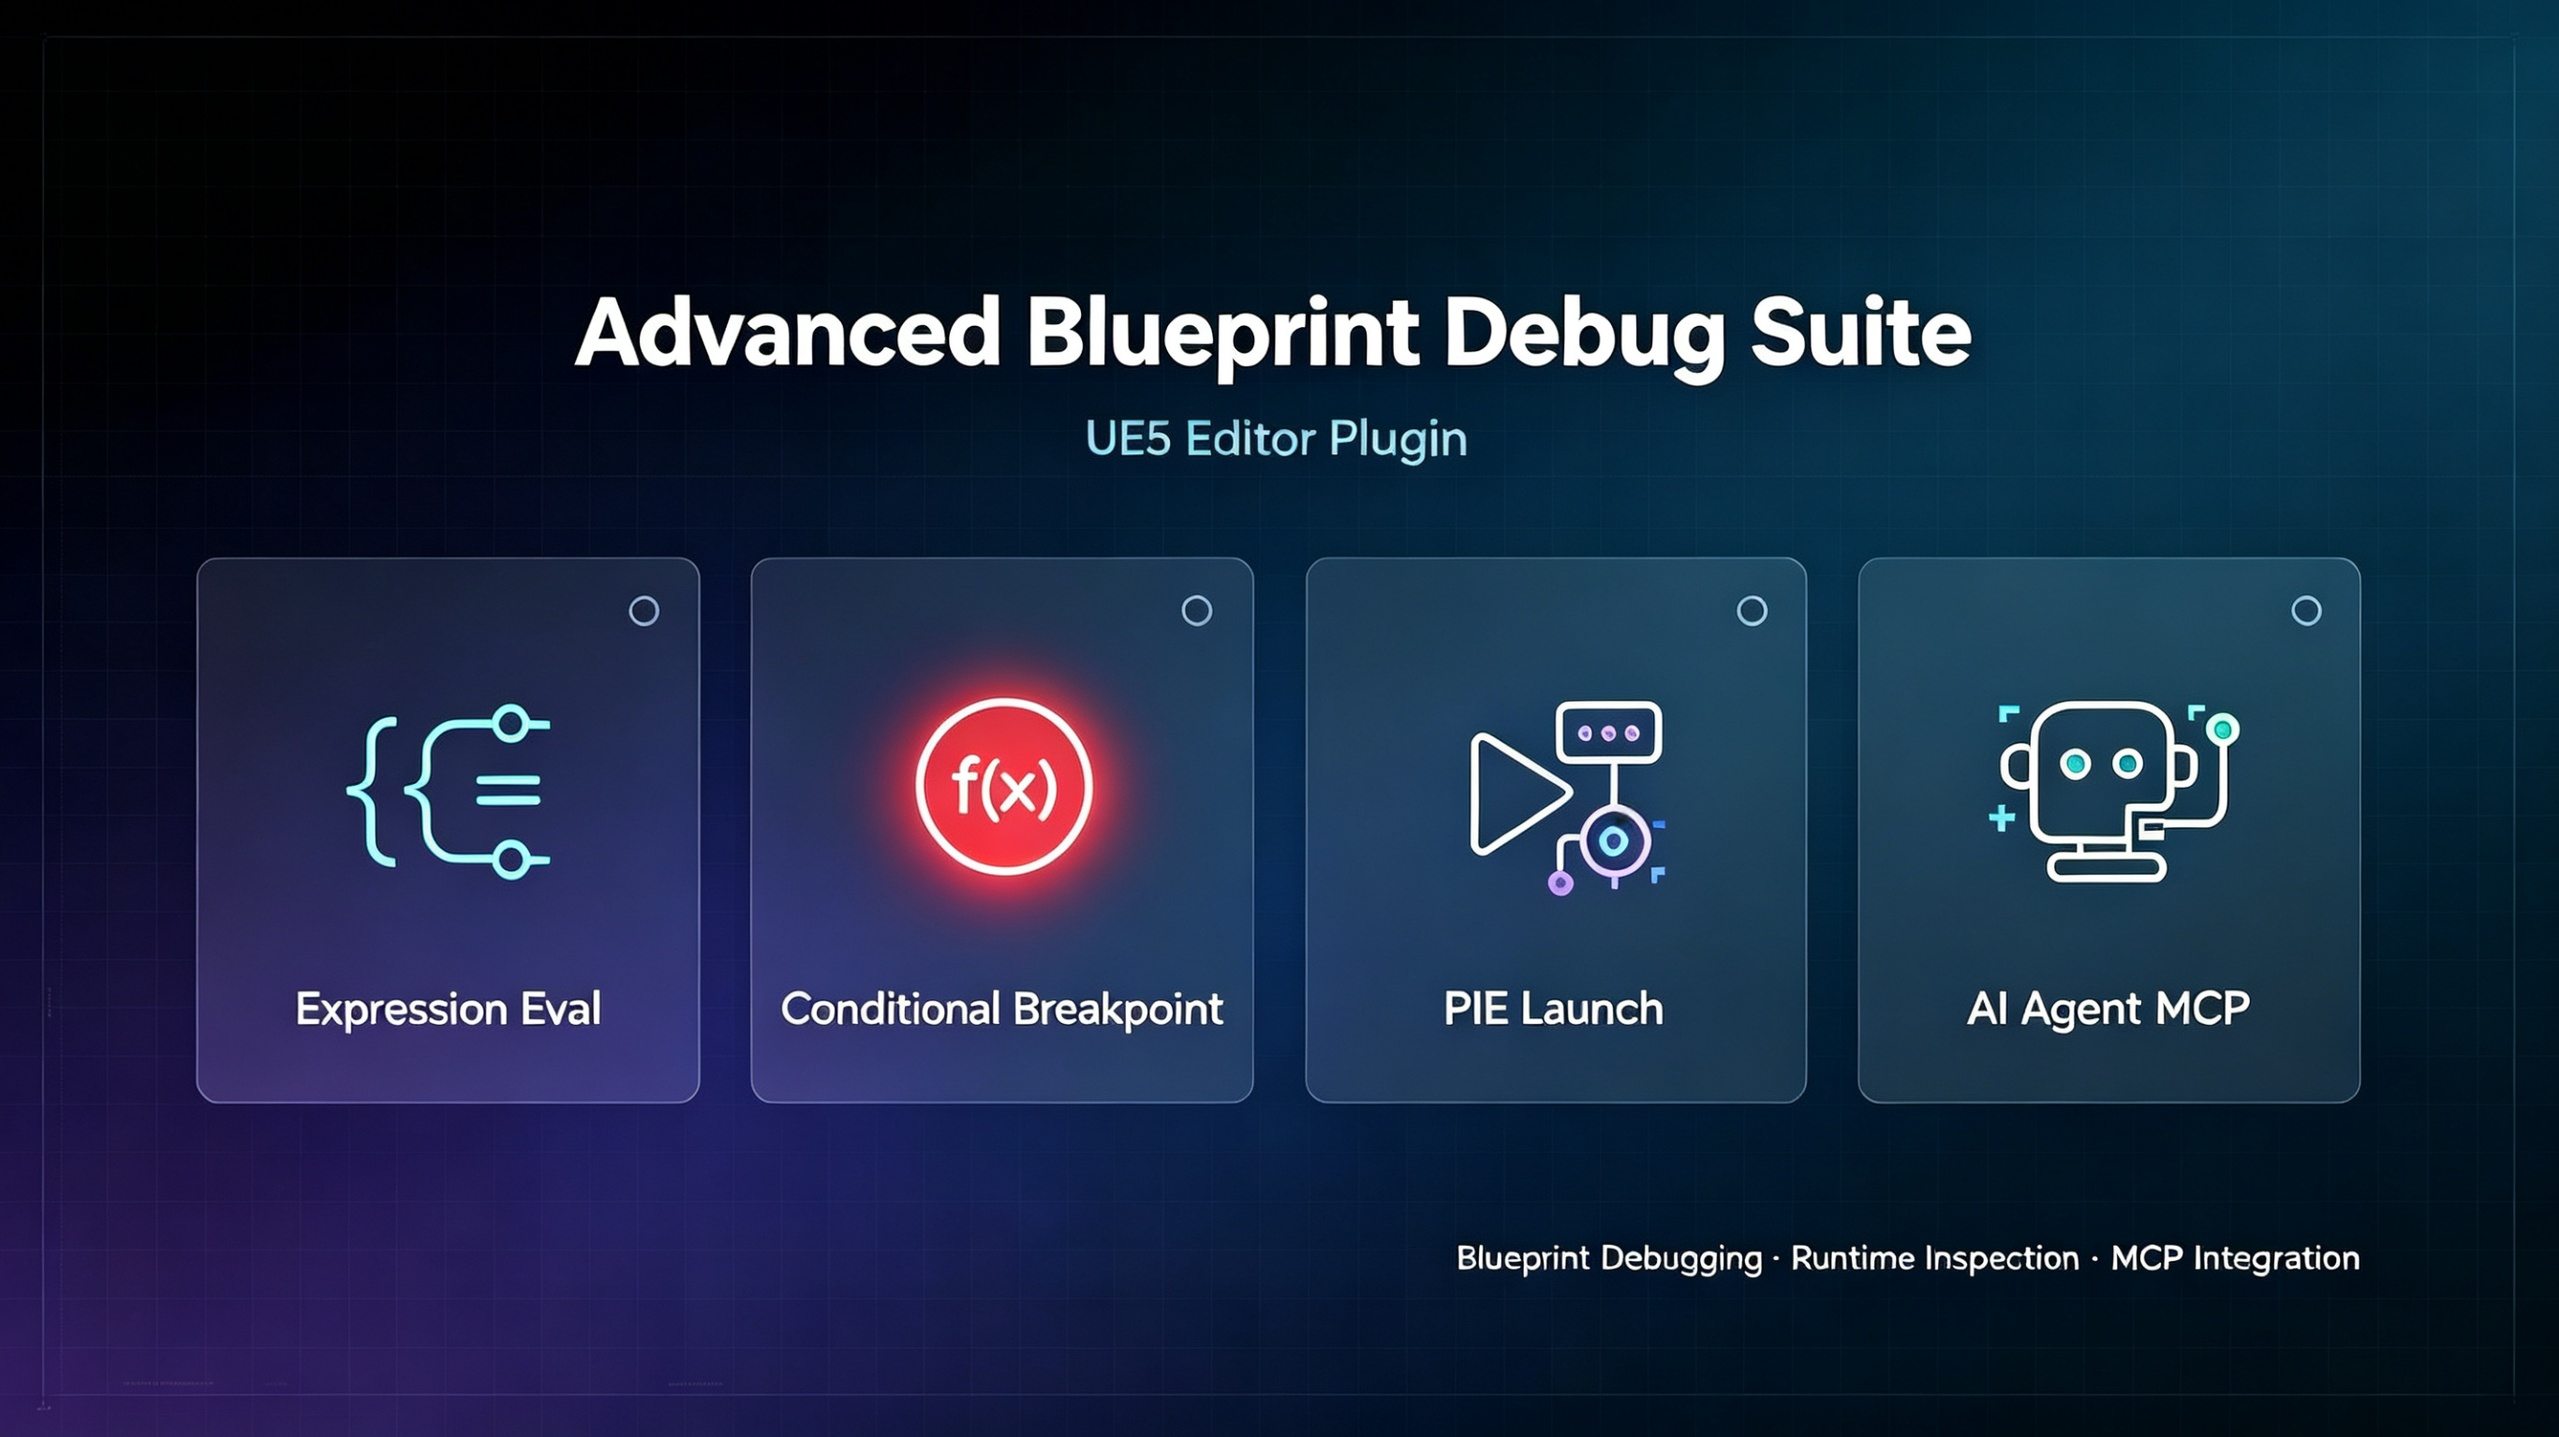
Advanced Blueprint Debug Suite
Stop wasting hours on repetitive Blueprint debugging. Debug smarter, not harder.
Traditional Blueprint debugging forces you to restart PIE, navigate menus, add temporary debug code, and manually press Continue hundreds of times. The Advanced Blueprint Debug Suite eliminates those bottlenecks with three powerful enhancements — Expression Evaluation, Conditional Breakpoints, and Parameterized PIE Launch — plus a built-in MCP service that exposes everything to AI Agents.
1. Blueprint Expression Evaluation
Debug without stopping. Inspect without editing. Call functions without restarting.
Have you ever been deep in a PIE session, hit a breakpoint, and realized you need to check a local variable that the debugger refuses to show on hover? Or wanted to trigger a function with parameters just to see what happens — but that would mean stopping, editing the Blueprint, adding a temporary node, restarting PIE, and replaying to the exact same state? And if the bug is hard to reproduce, that restart might lose the very conditions you need.
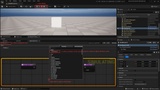
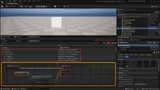
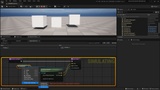
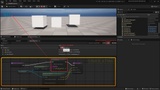
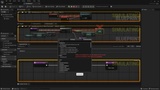
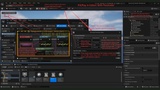
Expression Evaluation solves this. Edit Blueprint expressions as visual graphs directly in the plugin window — using standard nodes like engine functions, operators, and variables. Evaluate them at any time during PIE, whether paused or running, and see results in real time.
Reference live instances of the selected Blueprint class in the PIE world, and read local variables from the breakpoint interruption site — including some locals that the default debugger cannot evaluate by hovering.
Temporarily call functions or trigger events with parameters during PIE, without stopping debugging, editing Blueprints, adding temporary interfaces, or restarting.
Inspect object properties at any state — paused or running — to confirm values exactly when you need them.
Use expressions as conditions for conditional breakpoints (see below).
Editing / Locked states: edit the expression graph freely; lock (compile) it to evaluate. Evaluation is available only during PIE; when PIE ends, expressions automatically return to editing state.
2. Blueprint Conditional Breakpoints
Stop only when it matters. Skip the hundreds of useless interruptions.
You know the pain: a bug only appears on the 300th loop iteration, or when a variable crosses a specific threshold, or when a particular state combination occurs. With ordinary breakpoints, you press Continue again and again — or give up and add temporary logging.
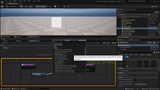
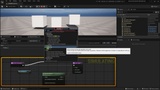
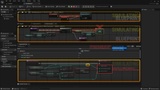
Conditional Breakpoints let you attach a Blueprint expression (first output pin must be bool) to a breakpoint. It interrupts only when the condition is true, and passes through automatically when false.
Ideal for “stop only when a specific condition is met” scenarios: variable reaching a threshold, state combination occurring, specific caller invoking a shared function, race conditions after many frames.
Hit counting: interrupt only on the N-th hit (e.g., “stop on the 300th loop iteration”). Counts persist across Ticks and PIE restarts, and can be reset manually.
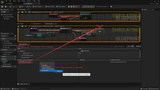
On a breakpoint hit, all checked expressions are automatically refreshed, presenting the interruption site alongside so you can inspect everything at once.
No more manual hit-checking. No more wasted Continue presses. Just precise, efficient debugging.
3. Parameterized / Specified-Map PIE Launch
Jump straight into the action. Skip the menus, restarts, and repeated setup.
Debugging a level entry flow? Testing a transition from another level? Or need to repeatedly start PIE and navigate through menus to select a level, then jump into a target map? Manual navigation and repeated restarts make debugging slow, inconsistent, and frustrating.
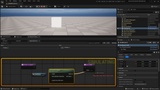
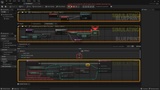
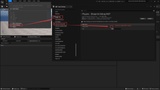
Parameterized PIE Launch lets you select launch parameters and the launch map directly from the editor toolbar. Every Play follows the current configuration — it can travel to a specified map (no need to open it in the editor first) and attach parameters (semantics identical to the Options parameter of the OpenLevel node).
Launch directly into a target level or gameplay state, bypassing menu selection and repeated manual operations.
Test level transitions and entry flows efficiently, without replaying the same navigation steps every time.
Parameter table supports multiple named presets with one-click switching.
Map list supports whitelist / blacklist filtering (wildcard rules + exceptions) — even long map lists become navigable.
Configuration is persisted in the project’s Saved directory.
Stop repeating the same clicks. Start debugging the actual problem.
4. AI Agent Debugging Support (Built-in MCP Service)
Let AI Agents debug Blueprints alongside you — even while you’re stopped at a breakpoint.
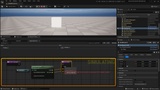
The plugin ships with a lightweight MCP (Model Context Protocol) service that exposes all of the above capabilities to AI Agents (TRAE / Claude and other MCP-capable clients).
Coverage: expression management / evaluation, breakpoints and condition attachment, execution control (start / stop / pause / resume / stepping), interruption-site inspection (local variables / pin values / call stack), object property read/write, graph editing, PIE launch configuration, and more — 40+ tools.
The service remains available during breakpoint interruptions — the Agent can read/write properties, evaluate expressions, and step through at the very spot where you are stopped, without any manual intervention in the editor.
Agents can conditionally break, evaluate complex expressions, and launch PIE with parameters — exactly the scenarios where manual debugging is slowest.
MCP URL: http://127.0.0.1:18233/mcp
Configuration Example:
{
"mcpServers": {
"unreal-blueprint-debug": {
"type": "http",
"url": "http://127.0.0.1:18233/mcp"
}
}
}
Why Advanced Blueprint Debug Suite?
Save hours on repetitive PIE restarts and menu navigation.
Stop only when it matters with conditional breakpoints and hit counting.
Inspect and call functions live — no stopping, no editing, no restarting.
Debug hard-to-reproduce issues without losing state.
Let AI Agents assist directly at the breakpoint, with full read/write and evaluation capabilities.
One plugin, 40+ MCP tools, seamlessly integrated into your Blueprint workflow.
Upgrade your debugging. Get the Advanced Blueprint Debug Suite today.