
説明
Level Performance Doctor
Your level drops frames somewhere.
Finding out why usually means walking through the map with stat unit open, watching numbers spike, repeating the same route from different angles, and then trying to guess which actors, materials, lights, effects or systems around you might be responsible.
Level Performance Doctor turns that manual investigation into an automated, repeatable performance analysis.
Choose a map. Set your target frame rate. Press Start.
A separate Unreal Editor instance loads the level, automatically determines measurement positions, moves a camera through them and records real Frame, Game Thread, Render Thread and GPU timings.
Your main editor remains usable while the analysis runs.
When the test is complete, Level Performance Doctor opens the results and shows you where performance drops, what was nearby, why it may matter and where you should investigate first.
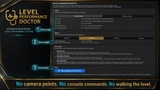
No camera placement.
No manual walkthrough.
No console-command workflow.
No guessing where the expensive areas are.
Documentation: Download
WHAT YOU GET
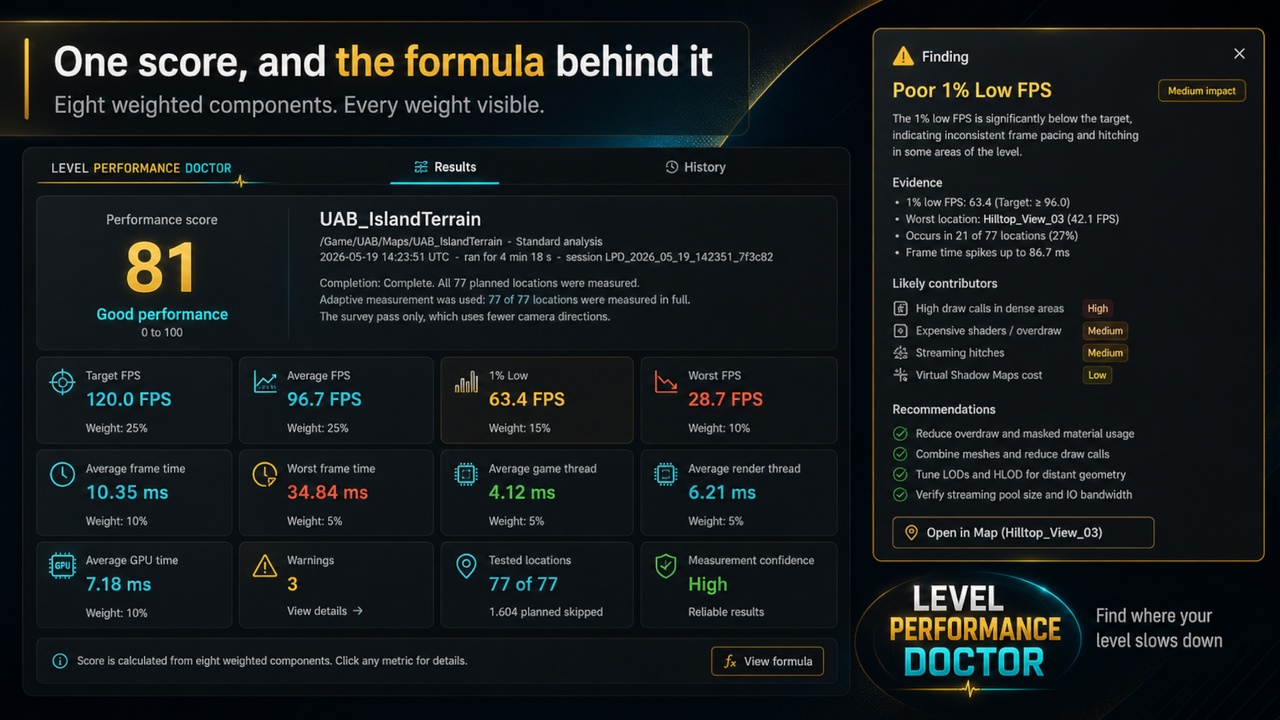
Performance Score — 0 to 100
Get an immediate overview of the level's measured performance against your chosen target.
The score is built from 8 weighted components. The complete formula and every weight are visible, so the result is transparent instead of being a mysterious rating you simply have to trust.
Viewport Performance Heatmap
Every measured location is drawn directly over your level viewport.
Colour, marker shape and marker size communicate the result together, helping the heatmap remain readable even when colour differences are difficult to distinguish.
The visualization does not spawn actors or modify your map.
See expensive areas at a glance and jump directly from a performance problem to the part of the level that needs investigation.
24 Evidence-Based Analysis Rules
Level Performance Doctor analyses potential problems across:
• Lights
• Static Meshes
• Skeletal Meshes
• Materials
• Actor Tick density
• Niagara
• Collision
• Decals
• Streaming
• World Partition
• And more
Findings are tied to the measurements that produced them.
If the tool does not have evidence for a finding, it does not publish it.
Likely Contributors
When a performance issue is detected, the tool identifies actors located near the measured cost and presents them as likely contributors.
From the result you can:
• Select the actor
• Focus the viewport on it
• Open its asset
This gives you a practical starting point instead of leaving you with nothing more than "this area is slow."
Contributor does not mean proven cause. It means the actor was near a measured performance cost and is worth investigating.
Actionable Recommendations
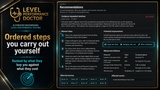
Findings include ordered optimization steps that you can evaluate and apply yourself.
Recommendations are ranked around two important questions:
How much performance might this improve?
How much work is it likely to require?
This helps you focus on changes with the best potential return instead of spending hours optimizing something insignificant.
THREE ANALYSIS MODES
Quick Scan
A fast sweep designed to answer the first question:
"Does this level have a performance problem, and where?"
Ideal for regular checks while building a level.
Standard Analysis
The recommended everyday mode.
It first surveys measurement positions from several camera directions. It then spends additional measurement time where the initial numbers justify deeper analysis.
On the development test level, this reduced a 25-position analysis time by 1.93x while producing the same triggered analysis rules as the exhaustive sweep.
Prefer measuring everything? The exhaustive behavior can be enabled with one setting.
Deep Analysis
For situations where you want the strongest evidence the tool can produce.
Deep Analysis measures 16 camera directions at every position and repeats each measurement.
Use it for detailed investigations, optimization passes or important before/after comparisons.
MEASUREMENTS YOU CAN INSPECT
The tool records real engine timing information including:
• Frame Time
• Game Thread Time
• Render Thread Time
• GPU Time when available
• Average performance
• Worst-case performance
• 1% low behavior
• Sample counts
• Outlier counts
• Measurement confidence
The values come from the same underlying engine performance counters used by Unreal's own stat unit system.
They are not generated by an AI model, predicted from scene complexity or replaced with synthetic estimates.
BUILT FOR MORE RELIABLE TESTING
Performance measurements are only useful when you know how they were collected.
Before samples are accepted:
• The camera is allowed to settle
• Streaming receives time to complete
• Frame behavior must reach a stability criterion
• Warmup samples are discarded
Outliers are not silently erased.
They are counted and reported. Regular averages exclude them while worst-case and 1% low statistics retain their impact, allowing you to see both typical performance and bad frames.
If a value cannot be measured, it displays Unavailable together with the reason.
It never silently substitutes 0.
This is especially important for GPU timing: an unavailable GPU measurement represented as zero would falsely look like an infinitely fast GPU and distort every result that depends on it.
Confidence Rating
Every measurement receives a confidence rating based on factors including:
• Warmup stability
• Streaming activity
• Sample count
• Frame-time spread
If a location could not be measured cleanly, the result tells you.
COMPARE OPTIMIZATION RESULTS
Optimization without comparison is guesswork.
Level Performance Doctor can compare two sessions from the same map by matching their measurement positions.
Run the analysis.
Make your optimization.
Run it again.
Then compare the sessions to see whether the change actually improved performance, made no meaningful difference or introduced a regression somewhere else.
This also makes the tool useful for recurring performance checks throughout production.
EXPORT EVERYTHING
Results can be exported in three formats:
HTML
A single self-contained report that can be opened in a browser or attached directly to a task, bug report or optimization ticket.
CSV
Six structured tables for spreadsheets, filtering and further analysis.
JSON
The complete result for custom tools, automation and internal pipelines.
SAFE BY DESIGN
Level Performance Doctor analyses your project. It does not rewrite it.
During analysis:
• No map is saved
• No actor is created
• No actor is modified
• No actor is deleted
• No asset is written
• No project setting is changed
Optimization recommendations are suggestions for you to review and apply yourself.
Session data is stored in:
Saved/LevelPerformanceDoctor
Exports are written only to the location you choose.
NO SHIPPING OVERHEAD
Level Performance Doctor is built as development tooling, not gameplay functionality.
Two of its three modules are uncooked-only and the remaining module is editor-only.
Nothing from the plugin is intended to become part of your packaged game.
Use it during development, then ship your project without carrying the profiler into the final title.
IMPORTANT LIMITATIONS
Level Performance Doctor measures performance on the machine running the test.
A level can score 88 on a high-end workstation and 40 on a laptop. Both results can be correct.
The score is therefore most powerful as a repeatable benchmark:
• Compare one area against another
• Compare one level against another
• Compare yesterday's build against today's
• Measure whether an optimization actually helped
• Detect regressions during development
The tool measures the editor environment, not a packaged Shipping build.
It also does not claim that proximity proves causation. A listed contributor was near a measured cost and is therefore a strong place to investigate — not automatically the cause of that cost.
Final profiling on representative target hardware is still an essential part of shipping a game.
REQUIREMENTS
Unreal Engine 5.5, 5.6, 5.7 or 5.8
Windows 64-bit
Every supported Unreal Engine version is compiled from the shipping plugin source before release.
The plugin is enabled automatically after installation. Nothing needs to be activated manually in the Plugin Browser.