
Descripción
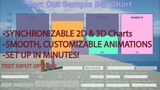
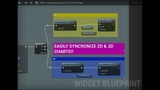
These charts are very easy to set up, and then to populate them with data you simply map your data to provide each section's value and title. The 2D chart has tons of configuration options for the visible y-axis range, and you can easily make the 2D chart and 3D chart use the same data set, keeping them synchronized.
Try it out free!
MacOS (Mac users may need to right click -> open to get the option to bypass security warning since this is unsigned)
Windows Tester COMING SOON
This chart can also be purchased as part of the Charts Pro Total Analytics - Starter Kit! This kit includes Bar Chart, Pie Chart, Heatmap Table, and Scatter Plot/Line charts. ($29.99)
SUPPORT: https://discord.gg/F4Yg2e5XVR | [email protected]