
描述
Fast Chart Widgets - Professional Data Visualization for Unreal Engine
Transform your Unreal Engine projects with stunning, high-performance charts that work seamlessly in games and applications. Fast Chart Widgets delivers professional-grade data visualization directly within your UMG widget system—featuring an intuitive API and 34 ready-to-use templates that get you from concept to beautiful charts in seconds.
YouTube Demo: https://youtu.be/WGKTZIkqAhQ
Documentation: Download PDF
Why Developers Love Fast Chart Widgets
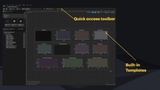
🚀 Instant Results - Browse 34 pre-built templates in the Chart Template Marketplace and add charts with a single click
🎯 Zero Learning Curve - Fluent Builder API makes chart creation intuitive in Blueprint or C++
📦 Ship-Ready - Runtime plugin with no editor dependencies, works perfectly in packaged builds
⚡ Performance First - Native Slate rendering ensures smooth FPS even with large datasets
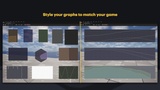
🎨 Fully Customizable - Complete control over colors, fonts, animations, and styling
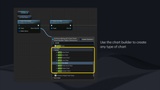
NEW: Chart Templates
Skip the setup entirely! The built-in Chart Template Marketplace puts 34 professionally-designed chart templates at your fingertips:
Open any Widget Blueprint → Click "Add Chart" in the toolbar
Browse templates by category → Performance, Gameplay, Multi-Data, Visual Styles, Minimal, Other
Click "Add to Widget" → Chart appears instantly, fully configured and ready to use
Templates include everything from FPS monitors and health trackers to neon-styled visualizations and compact sparklines—all pre-configured with appropriate data sources, styling, and animations (some use simulated data until hooked connected to real sources).
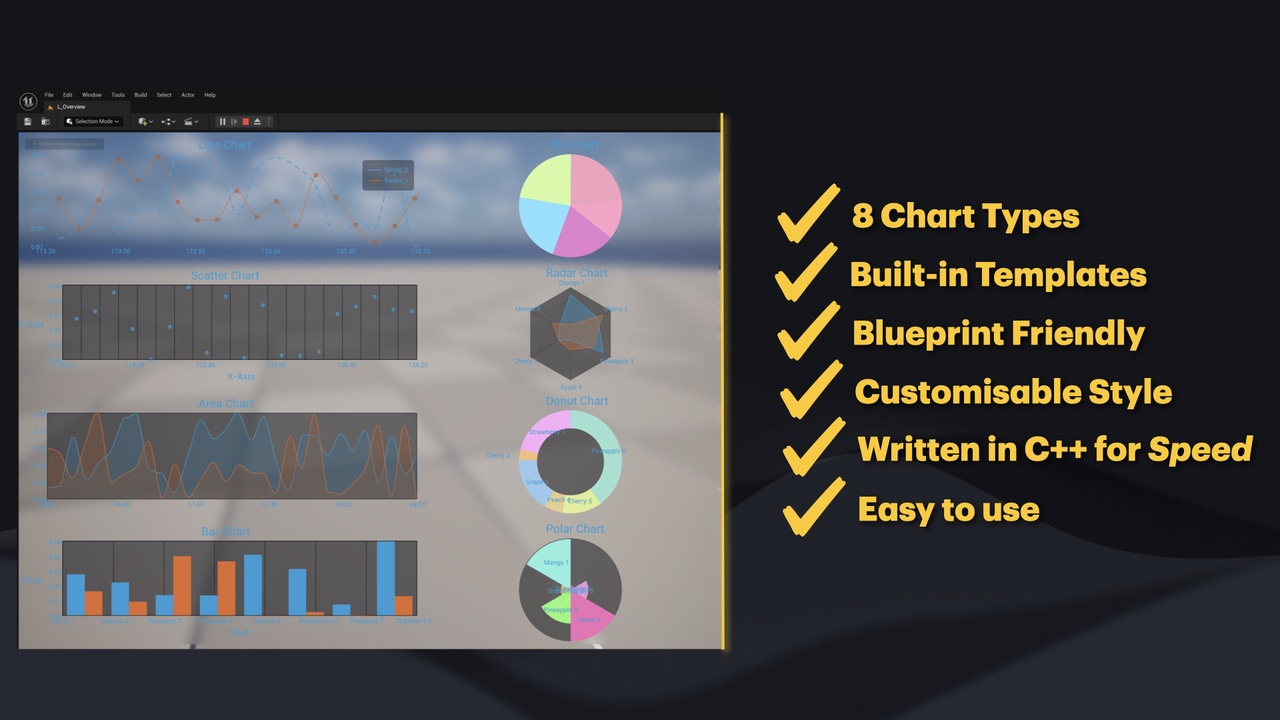
8 Chart Types
Cartesian Charts
✅ Line Chart - Trends, time series, continuous data
✅ Area Chart - Volume, cumulative values, stacked comparisons
✅ Bar Chart - Category comparisons, rankings, grouped data
✅ Scatter Chart - Correlation analysis, distribution patterns
Circular Charts
✅ Pie Chart - Part-to-whole relationships, proportions
✅ Donut Chart - Progress indicators, percentage displays
✅ Polar Area Chart - Radial quantity comparisons
✅ Radar Chart - Multivariate data, skill comparisons
34 Pre-Built Templates
Performance Monitoring (11 templates)
FPS Monitor • Mini FPS • Frame Time • Frame Time Variance • Memory Usage • Draw Calls • Game Thread Time • Render Thread Time • GPU Time • CPU vs GPU • Performance Bar
Gameplay HUD (7 templates)
Health Tracker • Ammo Tracker • Score Progression • Economy Tracker • Damage Output • Player Stats (Radar) • Speed Meter
Multi-Series Comparison (3 templates)
Dual Comparison • Triple Metrics • Data Dashboard
Visual Styles (6 templates)
Neon Glow • Retro CRT • Audio Levels • Heartbeat (EKG) • Signal Strength • Temperature Gauge
Minimal & Compact (4 templates)
Spark Line • Micro Chart • Delta Change • Moving Average
General Purpose (4 templates)
Blank Template • Stock Chart • Histogram • Efficiency Ratio
Key Features
Blueprint & C++ Support
Every feature is fully exposed to Blueprints with clean, well-documented nodes. C++ developers get a modern, fluent API with full IntelliSense support.
Built-in Demo Data Sources
Templates come alive immediately with built-in demo data—sine waves, random walks, stock patterns, heartbeat EKG, and more. Perfect for prototyping and testing before connecting your real data.
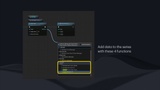
Multi-Series Support
Display up to 3 data series on a single chart with automatic color palette assignment. Compare datasets side-by-side with dedicated dual and triple comparison templates.
Real-Time Data Updates
Add data points dynamically and watch your charts animate smoothly. Perfect for live dashboards, performance monitors, or in-game statistics.
Smooth Animations
Built-in animation system with configurable duration and easing. Entry animations, data transitions, and hover effects all work out of the box.
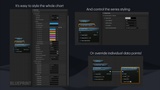
Complete Theming System
Customize every visual aspect—background colors, grid styles, fonts, series colors, marker shapes, legends, and more. Match your game's aesthetic perfectly.
Perfect For
🎮 Games - Player stats, skill trees, inventory comparisons, economy visualizations
📊 Simulations - Real-time sensor data, performance metrics, system monitoring
💼 Applications - Analytics dashboards, data exploration tools, business intelligence
📚 Educational - Interactive learning experiences, data science visualization
🥽 VR/AR - Immersive data displays and information panels
Quick Start
The Fast Way (Templates)
Open any Widget Blueprint
Click "Add Chart" in the toolbar
Browse templates and click "Add to Widget"
Done! Chart appears with demo data running
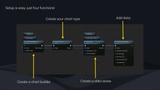
Blueprint (Custom)
Add Fast Chart Widget to your Widget Blueprint
Call CreateBuilder() → SetChartType() → AddSeries() → AddDataPoint() → Build()
Done! Your chart is ready.
What's Included
Fast Chart Widget component
34 pre-built chart templates with Chart Template Marketplace UI
8 fully-featured chart types
20+ built-in demo data sources
Complete theming system
Animation framework
Example content & demo project
Comprehensive documentation (User Guide + Technical Reference PDFs)