
Description
History:
V1.5
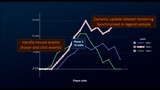
Add the option to manually control a data set animation, by explicitly setting animation progress, for a given data set or all data sets at once
Add an option to restart an animation (if automatically controlled by time settings), for a given data set or all data sets at once
Add a getter function to retrieve current animation progress, for a given data set or all data sets at once
Update all C++ methods and parameters from private visibility to protected, to ease inheriting base C++ classes
V1.4
Add a public method to update Grid Settings at runtime
V1.3
Performance improvement (reduce CPU cost, GPU cost and memory footprint)
Fix graph segment not perfectly connected (affecting only UE 5.6 version)
V1.2
Add a public method to update vertical/horizontal labels settings at runtime
Add the location of mouse events relative to the plugin widget, in addition to absolute location
V1.1
Improve CPU performances and decrease memory consumption
Allow using "Fit to data" with "Always show axis" settings
Fix UpdateFitToData not handling axis visible settings
Fix UpdateFitToData not always updating ranges
Update documentation with more details regarding C++ usage
Drag and drop the user widget into your UI and provide a dataset to display, and that’s all!
Demo video: Plugin show case
Refer to the documentation to see the list of available features and customization options.
Setup the appearance of the widget using settings structures, no code required:
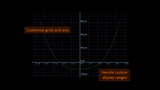
Axis and label configuration, background grids
Colors, thickness, shadows, outlines
Dots (image) on dataset values
Manual display range or Fit to data mode
And more… (the widget exposes more than 80 settings)
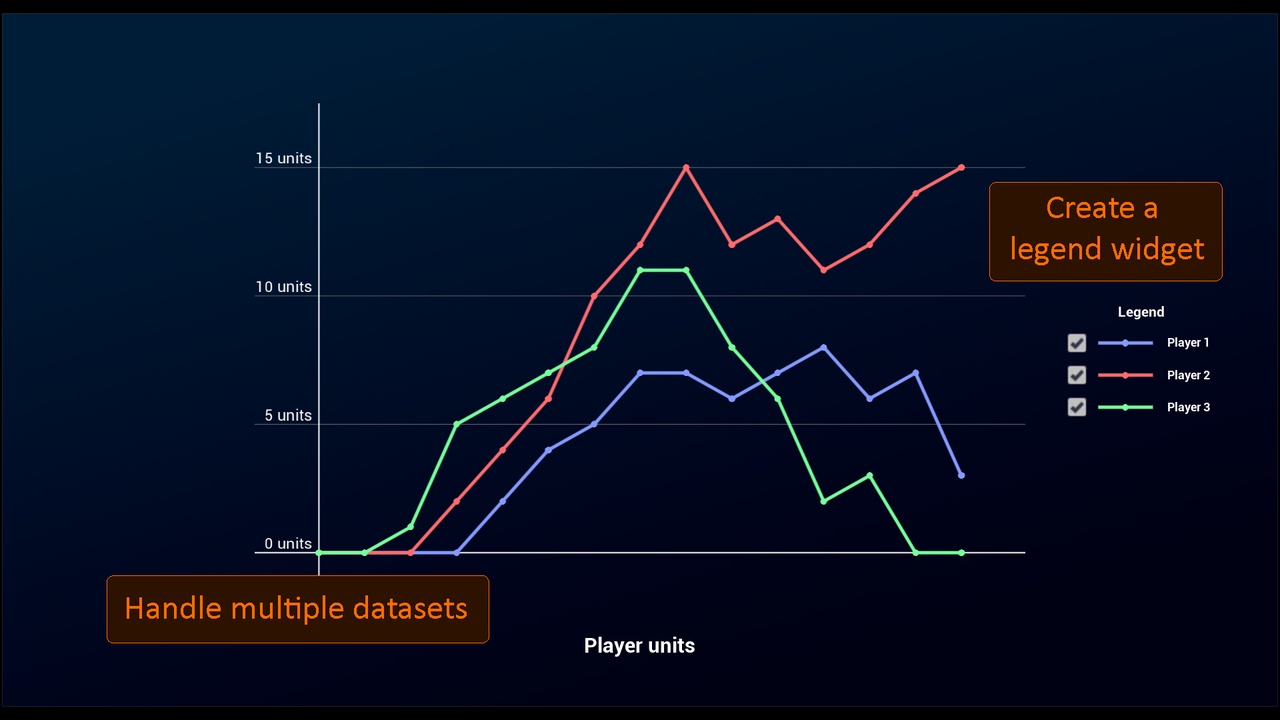
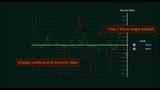
Show as many datasets as you want on the widget, update data in real time for dynamic charts.
Trigger events for mouse hovering and click events on any dataset value.
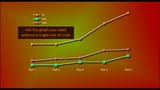
Comes with an additional user widget “sampling” a given dataset rendering (allowing creating a graph legend UI for instance).
Fully written in C++ for best performances when working with huge datasets.
All methods and parameters are accessible both from C++ and Blueprint.
Features:
Embed the widget as any user widget in your user interface
Show as many datasets as you want
Update a datasets content at any time (including changing the length of it)
Fit to data or manual display range
Configure X / Y axis (visibility, color, thickness, shadows, outlines, name)
Configure background grids (grid size, horizontal / vertical grid lines visibility, color, thickness, shadows outlines), add several grids with various sizes
Configure text labels on vertical / horizontal axis (position, color, size, unit text)
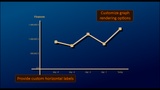
Provide custom horizontal labels for nonlinear values or custom values
Mouse events triggering (hover and click)
Configure appearance of each dataset: Color, thickness, shadows, outlines
Add Dots image on each dataset value
Animate display of a dataset (drawn from left to right)
Show / hide dataset dynamically.
Update dataset rendering options dynamically.
Use the dedicated “Sample” widget to draw a sample line and dots of a dataset
Refer to the documentation to see the list of available features and customization options.