Описание
# UE Charts — 23 Slate-Native Chart Widgets for Unreal Engine
Build professional dashboards, analytics panels, and data-driven UIs directly inside Unreal Engine — no web plugins, no third-party libraries, no runtime textures.
---
## Why UE Charts?
Most Unreal projects that need charts resort to embedding web browsers, loading external JavaScript libraries, or importing texture atlases. UE Charts takes a fundamentally different approach: every chart is a native UMG widget rendered purely through Slate's hardware-accelerated draw pipeline.
This means:
- Zero overhead — No browser process, no JS engine, no HTTP server
- Pixel-perfect integration — Charts behave exactly like native UMG widgets: layout, clipping, input, z-order
- No external dependencies — Compiles on Windows, Mac, and Linux out of the box
- Safe for shipping — No textures to load, no materials to compile, no network access required
---
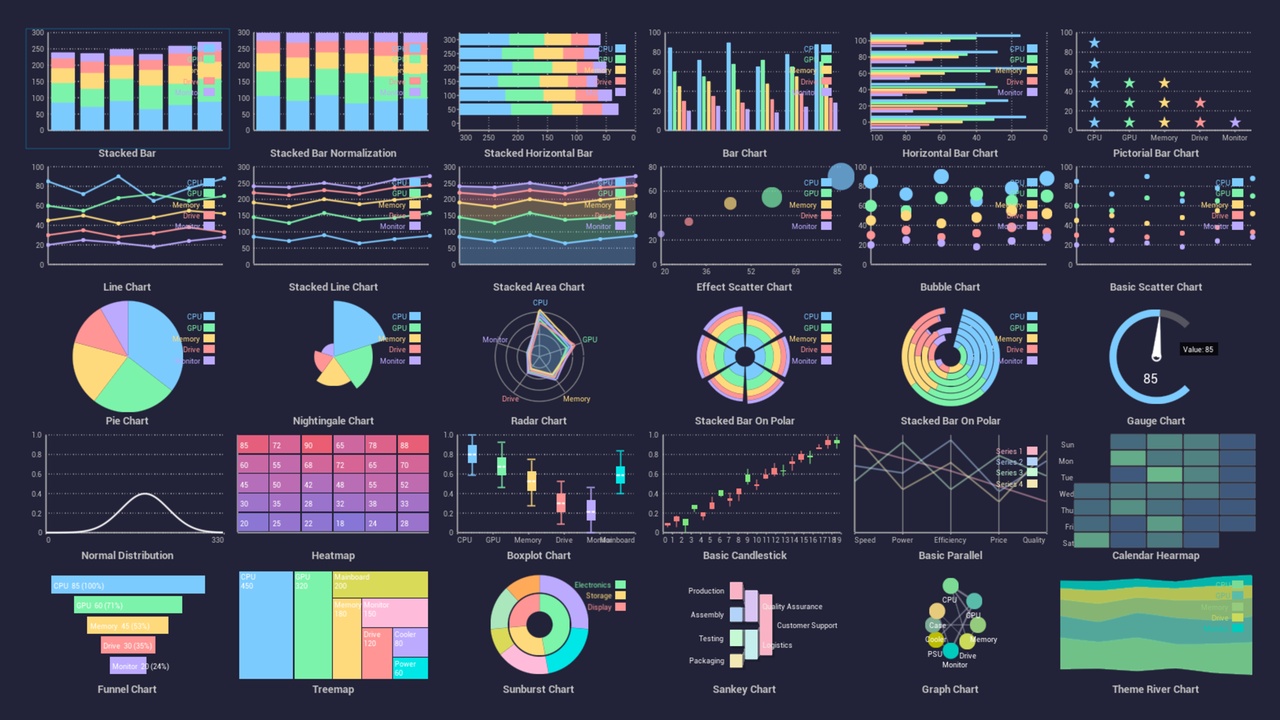
## What's Included — 23 Chart Widgets
| Widget | Type | Description |
|--------|------|-------------|
| UBarChart | Bar | Stacked vertical bar chart with hover highlighting |
| UHorizontalBarChart | Bar | Horizontal bar chart — grouped & stacked modes |
| UPictorialBarChart | Bar | Pictorial bar chart with custom fill graphics |
| ULineChart | Line | Multi-series line chart — area fill, data points, stacked |
| UThemeRiverChart | Line | ECharts-style streamgraph — Catmull-Rom smoothed river bands |
| UNormalDistributionChart | Line | PDF / CDF / LogNormal distribution curves |
| UPieChart | Radial | Donut / Pie chart — inner radius, rose mode, hover explode |
| USunburstChart | Radial | Multi-level sunburst for hierarchical data |
| URadialBarChart | Radial | Radial bars — stacked along angular axis |
| UTangentialBarChart | Radial | Tangential bars — bars along tangent direction |
| UScatterChart | XY | Scatter / bubble plot (3-variable) with ripple highlight |
| URadarChart | Polar | Radar chart — polygon fill + concentric grid rings |
| UParallelChart | Multi-Axis | Parallel coordinates for multi-dimensional data |
| UHeatmapChart | Heatmap | Rectangular heatmap with row/column labels |
| UCalendarHeatmapChart | Heatmap | Calendar heatmap — year/month/week (GitHub-style) |
| UCandlestickChart | Financial | OHLC candlestick — green bullish, red bearish |
| UGraphChart | Graph | Force-directed node-link network graph |
| USankeyChart | Flow | D3/ECharts-style Sankey flow diagram |
| UFunnelChart | Flow | Funnel chart — decreasing trapezoids for pipelines |
| UTreemapChart | Part-Whole | Treemap — slice-and-dice hierarchical area layout |
| UBoxplotChart | Statistical | Box plot — min / Q1 / median / Q3 / max |
| UGaugeChart | Gauge | Arc gauge with anti-aliased needle pointer |
---
## Key Features
Rendering — 100% Slate-native (`MakeCustomVerts` / `MakeLines` / `MakeBox`). Analytic AA material for pixel-perfect circles, rings, and arcs — toggleable via `bAntiAlias`. Catmull-Rom smoothing on streamgraphs. Dedicated deferred AA pipeline for lines, dashed lines, and rect edges. Zero runtime textures or materials required.
Data Input — 100% Blueprint-compatible. Push raw `TArray<FChartData>` via `SetData()` or structured `FChartDataset` with grammar-of-graphics encoding (X/Y/Value/Category/Series/Size/Source/Target) via `SetDataset()`. Every chart displays sample data in the UMG Designer.
Theming — 8 preset themes (Dark / Light / Retro / Neon / Pastel / Forest / Monochrome). One Blueprint call: `ApplyPresetThemeByType(Dark)`. Supports custom `FChartTheme` structs and auto-gradient via `SetDataUsingAutoColor()`.
Interaction — `OnHovered` and `OnDataClicked(DataID)` delegates. Automatic per-datum hit-test regions with `GetSeriesAtPosition(ScreenPos)`. Legend click-to-toggle series visibility. Built-in `{Label}: {Value}` tooltip with configurable format. Marquee brush-select.
Annotations — MarkLines (reference lines with dash + label). Data labels with `{Label}`/`{Value}` placeholders. Rich text labels (`{bold:}`, `{color:}`, `{small:}` tags). Title, VisualMap gradient bar.
DataZoom — Slider with drag handles to zoom data ranges, configurable min span, `OnZoomChanged` delegate.
Animation — Lerp-based transitions on data change, configurable duration + easing, optional on-load animation from zero.
Architecture — 3-tier layout (Full → Canvas → Plot), unified ECharts-order paint pipeline, auto-normalized Y-axis (`MaxYValueNormalize`), collapsible panel widget included.
---
## Use Cases
| Domain | Examples |
|--------|----------|
| Game Analytics | Player stats dashboard, FPS monitor, heatmap of player deaths |
| Business Dashboards | Revenue charts, KPI gauges, sales funnel analytics |
| Simulation & Training | Real-time sensor plots, scientific data monitoring |
| Finance & Economy | Stock market OHLC charts, portfolio pie charts, cash-flow Sankey diagrams |
| Construction & BIM | Energy usage heatmaps, project progress radial bars |
| Health & Fitness | Heart-rate line charts, calorie treemaps, workout radar charts |
---