
Descrição
[Join Our Discord] for Support
Blueprint Node Profiler Pro
Ultra-Lightweight Blueprint Performance Profiler for Unreal Engine
Overview
Blueprint Node Profiler Pro is a high-performance, runtime-safe profiling plugin for Unreal Engine that helps developers identify expensive Blueprint logic, tick abuse, and runtime hotspots with near-zero overhead.
Designed for AAA-scale projects, large AI simulations, and Blueprint-heavy games, this plugin provides manual scope profiling, world tick analysis, and actor tick cost detection — without relying on heavy editor-only tools or Unreal Insights.
Key Features Manual Scope Profiling (Runtime Safe)
Profile any Blueprint logic block using simple Begin/End scope calls.
Profile loops, AI logic, gameplay systems, or Tick
Works in Game & PIE
No editor dependency
Aggregated stats: Calls, Avg ms, Max ms, Total ms
World Tick Performance Monitoring
Track overall world tick cost in real time.
Average world tick time
Live on-screen display
Ideal for detecting global performance regressions
Actor Tick Cost Detection
Identify actors that are abusing Tick.
Measures per-actor tick cost
Automatic tick-spam detection
Configurable thresholds
Warnings logged when performance limits are exceeded
Live On-Screen Stats
Toggle a lightweight overlay during gameplay.
World tick average
Custom scope timings
Zero editor overhead
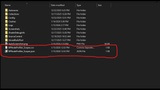
CSV & JSON Export
Export all profiling data for external analysis.
Scopes
Actors
Clean CSV for Excel / Google Sheets
Structured JSON for tooling & automation
Files are saved automatically to:
Saved/
Performance First Design
Blueprint Node Profiler Pro is built with strict performance constraints:
No reflection-heavy hooks
No editor tick dependencies
No UObject allocations per frame
Uses high-precision FPlatformTime
Safe for shipping builds
You can profile thousands of scope calls per frame without measurable overhead.
Intended Use Cases
✔ AI systems & behavior logic
✔ Large Blueprint loops
✔ Tick-heavy gameplay actors
✔ Runtime performance debugging
✔ Optimization before shipping
✔ Mobile & console profiling
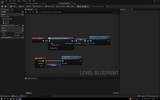
How It Works (Simple)
Call ProfileScopeBegin
Execute your Blueprint logic
Call ProfileScopeEnd
Toggle stats or export results
No setup. No editor windows. No rebuilds.