
الوصف
"PBR Visualizer - a Material Debugging & Visualization Toolset"
Version 1.1.0
New in 1.1.0 - Customization
New in 1.1.0 - Color Blindness Visualizations
Empower your material workflows with real-time PBR compliance checks and intuitive visual diagnostics.
NOTE: Images used on this store page are to showcase the tools functionality only. The assets used such as the Unreal Mannequin, Weapon and Epic's City Sample Buildings pack and Cropout sample are NOT included in this Plugin.
PBR Visualizer is a comprehensive debugging and visualization toolkit designed to help you quickly identify and resolve PBR-related material issues within your Unreal Engine projects. By providing real-time feedback on Base Color ranges, Metallic, Roughness, Specular, and Ambient Occlusion values, this suite streamlines the troubleshooting process—ensuring that your materials consistently meet industry-standard PBR guidelines.
With just a click, you can access custom debug views and overlays directly in your Unreal Engine viewport. PBR Visualizer makes it straightforward to pinpoint the root cause of material discrepancies, highlight out-of-range values, and confirm that your surfaces are conforming to expected material values. These features come packaged in an intuitive Editor Utility Widget.
You could also add the tool’s visualizations to your existing Buffer Visualization options for seamless toggling during lookdev and production, unlocking the ability to assign hotkeys.
Whether you’re a professional environment artist, technical artist, or a solo developer striving for polished visuals, PBR Visualizer is your one-stop solution for PBR material compliance and quick visual diagnostics.
Key Features:
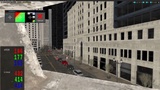
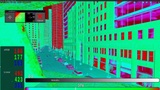
Real-Time PBR Compliance Check:
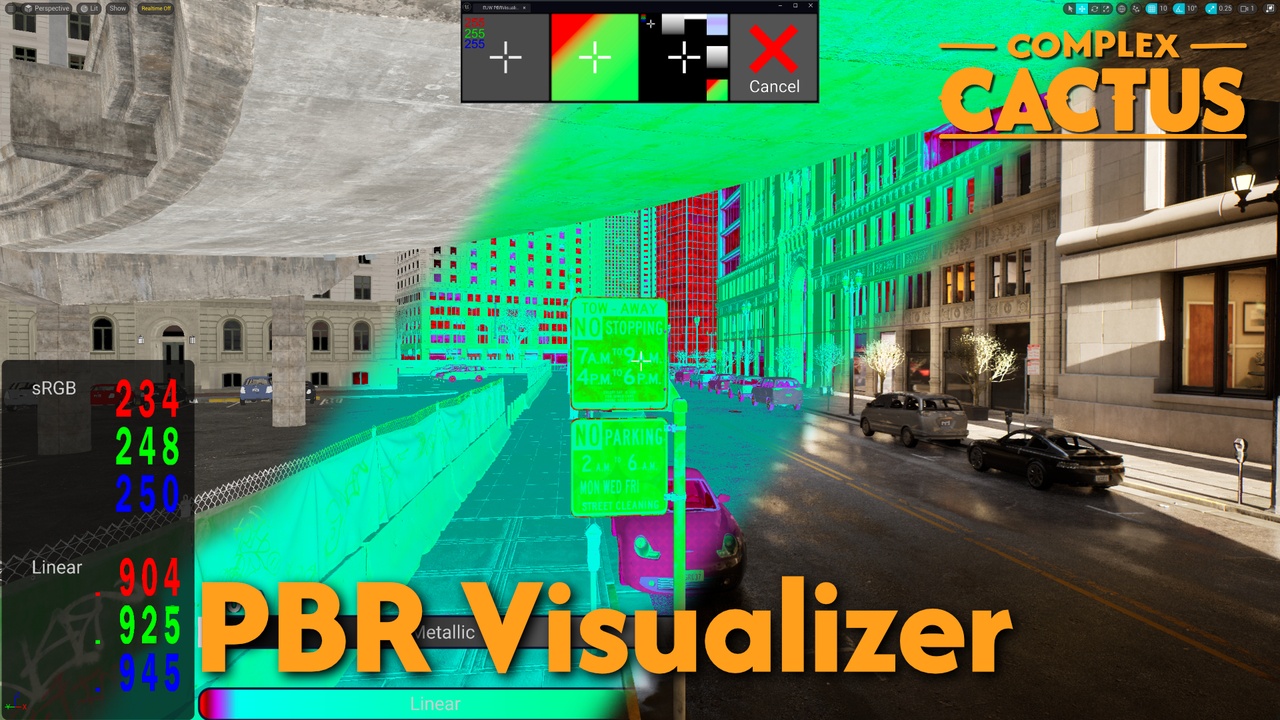
Instantly visualize whether Base Color values fall within correct PBR ranges for both dielectric and metallic materials.
Color-coded overlays (Red for out-of-range, Green for in-range, Blue for marginal values) provide immediate visual feedback.
Detailed Pixel-Level Readouts:
Crosshair-based pixel sampling allows you to inspect exact sRGB and Linear values at the center of your screen.
Quickly determine if a pixel’s color is precisely what you expect, and confirm whether it adheres to PBR guidelines.
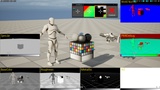
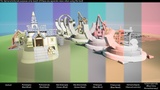
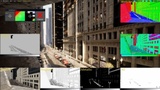
Comprehensive Material Property Debug Views / Validator:
Access an in-editor grid of viewport panels displaying Base Color Roughness, Metallic, Specular, Normal, AO and PBR Visualization Debug views with sliders displaying center-pixel values.
Compare and contrast material attributes side-by-side to diagnose potential issues or imperfections.
Editor Utility Widget Integration:
Control all debug modes from a dedicated Editor Utility Widget.
Rapid Troubleshooting & Diagnosis:
Ideal for debugging unexpected shading, ensuring materials appear consistent across different lighting conditions and scenes.
Identify subtle mistakes in textures, Base Color settings, or metallic workflows, reducing iteration times and guesswork.