설명
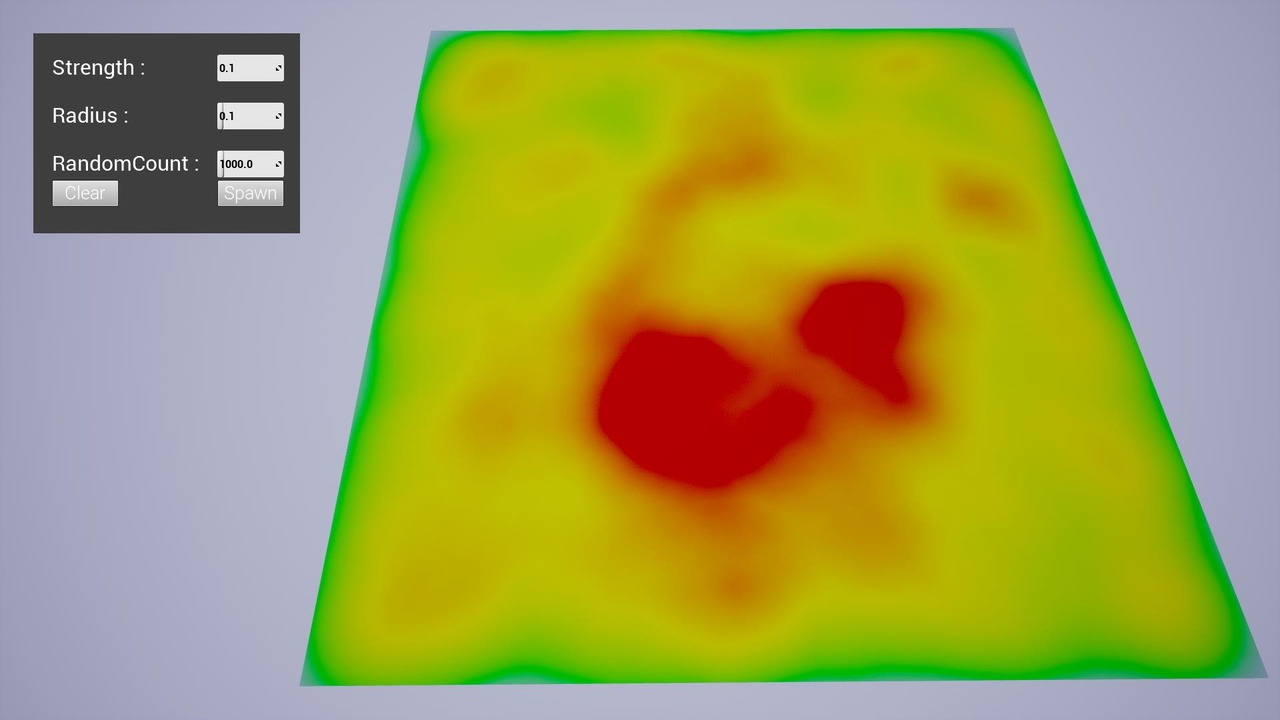
Turn raw data into an instant, at-a-glance heat map. Define a min/max range, feed in data points, and the chart colors itself automatically — the denser the points, the more vivid the color.
Simple and easy to use, with every function exposed to Blueprint. Drop the actor into your level, call a single node to plot one point or a whole array, and watch the heat map update in real time at runtime — no gameplay code required.
Standout features:
High-precision data support — a dedicated double-precision actor handles large coordinate values (e.g. latitude/longitude) without losing accuracy.
Single- and double-precision actors — pick the right one for your data and performance needs.
Two display modes — a flat plane mesh, or a decal that conforms to terrain.
Fully customizable gradient — set your own 4-color scale, plus per-point strength and influence radius.
Normalized coordinates — map your data straight onto the chart without manual conversion.
Runtime-ready — pure C++ runtime module, cross-platform (Win / Mac / Linux / Android / iOS).
Use it to visualize player hotspots, population density, sensor readings, geographic data, or any dataset that benefits from a color-coded spatial view. A sample map and ready-to-use Blueprints are included so you can see it working immediately.
Link to Document:
https://drive.google.com/file/d/1WWk4mlCKqQB6RsApA54Q3WsPYJU6IcJe/view?usp=sharing